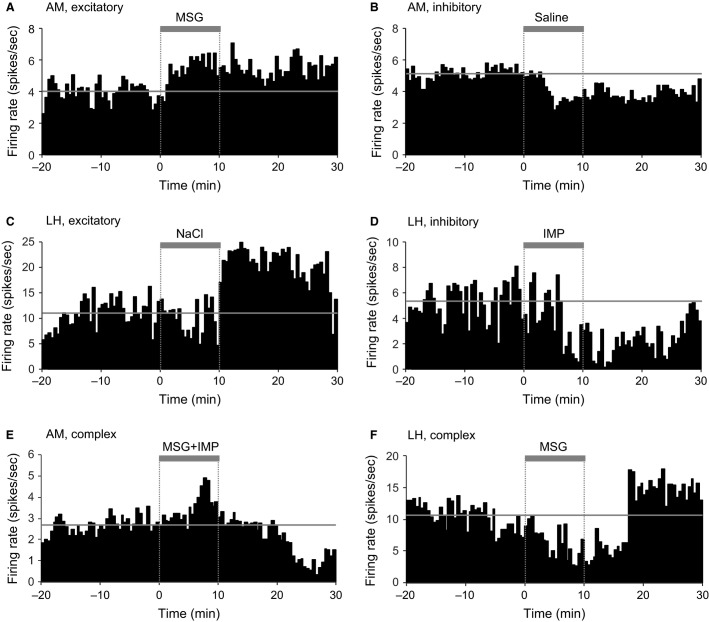
Figure 3.
Examples of neural responses to intragastric administration of solutions in intact rats. Perievent histograms of three amygdalar (AM) neurons (A, B, E) and three LH neurons (C, D, F). Time 0 indicates the onset of solution administration. Thick gray bars on the histogram indicate solution administration. Horizontal thin gray lines indicate the mean baseline firing rates.

