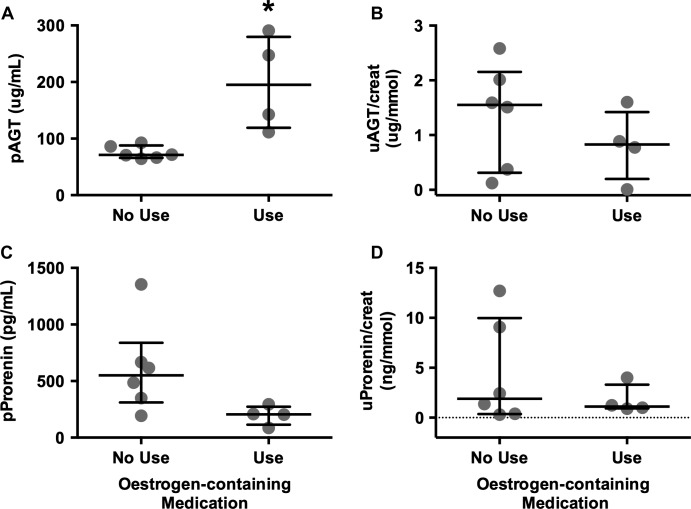
Figure 2.
The effect of estrogens on (A) plasma AGT, (B) uAGT/creat, (C) plasma prorenin, and (D) uProrenin/creat ratios in women are divided according to whether they were (n = 4) or were not taking estrogens (n = 6). *P < 0.01. Data are presented as individual values with median and interquartile ranges indicated.

