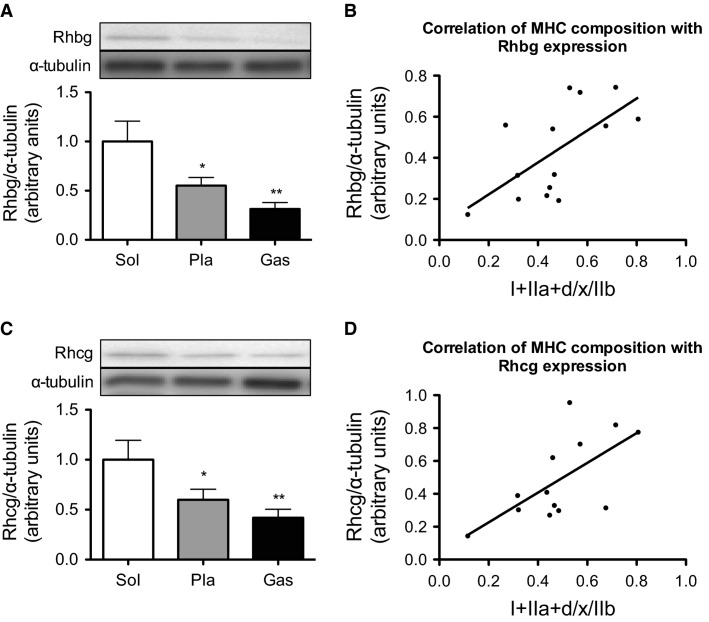
Figure 2.
Content of Rhbg (A) and Rhcg (C) in Sol, Pla, and Gas. Values represent the mean ± SE (n = 6–7). *P < 0.05, **P < 0.01 versus Sol. (B) Correlation between MHC I and IIa + d/x to MHC IIb ratios and Rhbg content in Pla and Gas. (D) Correlation between the MHC I and IIa + d/x to MHC IIb ratios and Rhcg content in Pla and Gas.

