
Fig. 3. Brain MRIs detected inflammation following IL13-zetakine+ CTL administration.
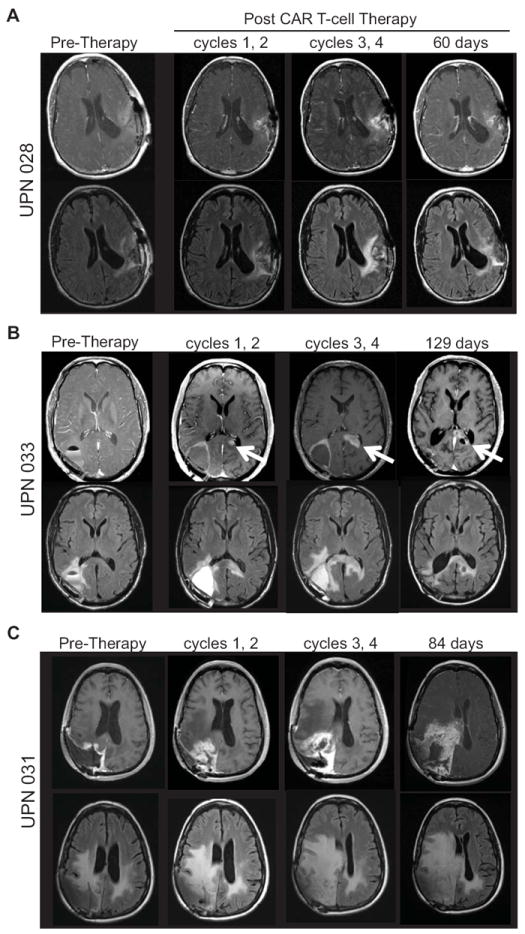
MRI for (A) UPN028 (B) UPN033, and (C) UPN031 before and after intracranial administration of IL13-zetakine+IL13-zetakine+ CD8+ CTL. MRI images are shown pre-therapy, i.e., post surgical resection and prior to T cell administration (within 12 days), as well as following cycles 1 and 2 (within 10 days), following cycles 3 and 4 (within 5 days), and 60 days or more after the last T cell treatment. Top rows, post Gd T1-weighted images demonstrating changes in contrast uptake at the site of T cell injections over treatment duration. Bottom rows, FLAIR images without Gd highlighting progression of cerebral edema following T cell therapy. White arrow indicates site of tumor recurrence for UPN033.