
Fig. 4. Effect of CAR T cell therapy on IL13Rα2 expression by the tumor of UPN031.
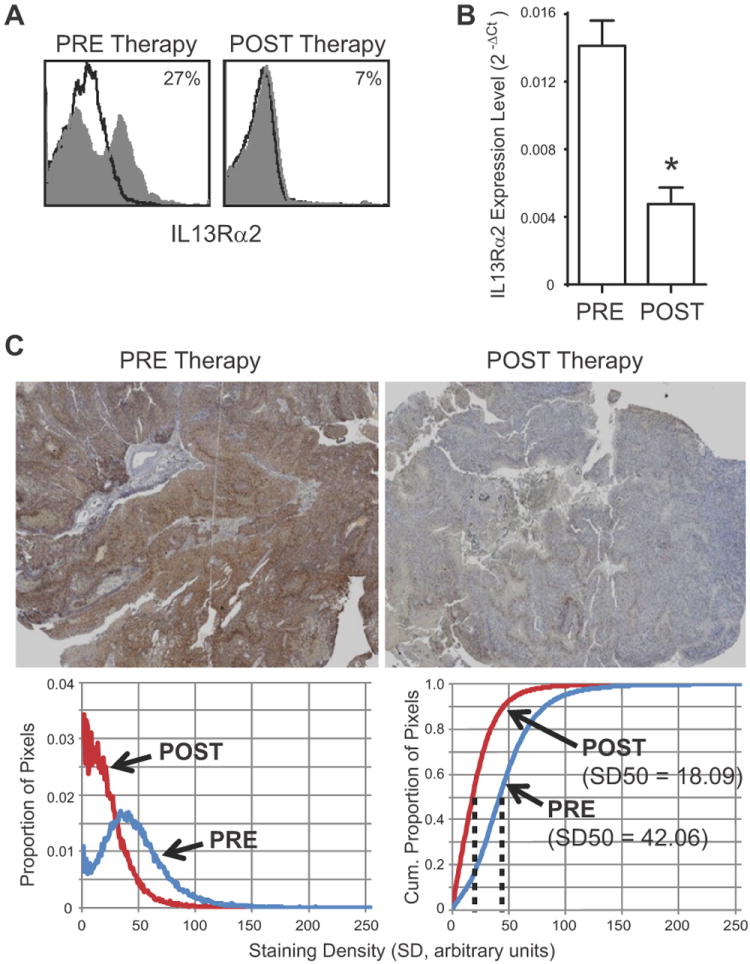
Primary patient derived brain tumor tissue from UPN031 was excised at day 8 (PRE Therapy) and day 184 (POST Therapy) according to the timeline depicted in Figure S2B. A, Flow cytometric analysis of IL13Rα2 surface expression by freshly-dissociated tumor cells using fluorochrome-conjugated anti-IL13Rα2 antibody. Percentage of immunoreactive cells (grey) above isotype control (black line) is indicated in each histogram. B, Gene expression of IL13Rα2 mRNA levels evaluated by qPCR using Taqman gene expression assay. C, Immunochemical staining (IL13Rα2-specific DAB with hematoxylin counterstain; top) and histograms of IL13Rα2-specific DAB staining density (below). Left, proportion of pixels with IL13Rα2-specific DAB staining between 0 (clear) and 255 (opaque). Right, cumulative proportions of pixels with IL13Rα2-specific DAB staining, with median values (SD50) indicated.