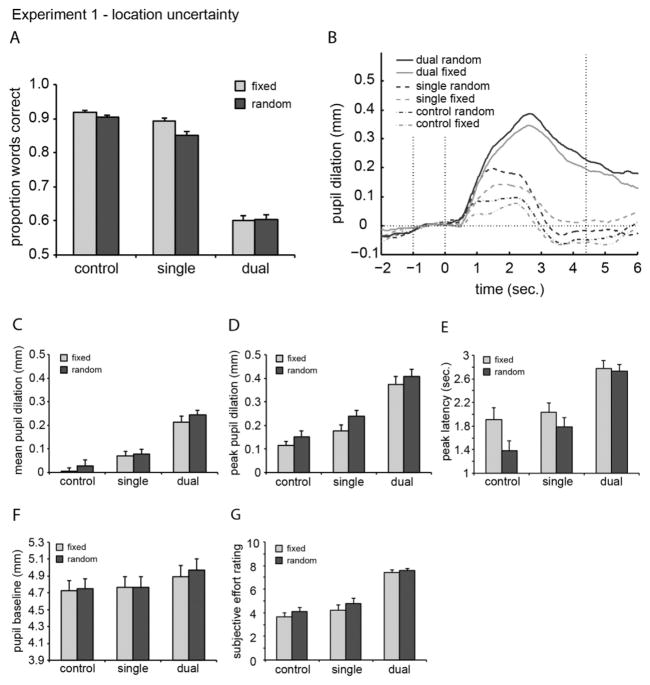
Fig. 1.
(A) Performance for each condition in Experiment 1, averaged over SNR and participants. Error bars indicate the standard error of the mean. (B) Pupil responses for each condition, averaged over SNR and participants. The onset of the sentences was at 0 s. The baseline, calculated as the average pupil diameter over one second preceding the start of the sentence, is shown by the dashed horizontal line. The time window over which the mean pupil dilation was computed corresponds to the range between the second and third dotted vertical lines. (C, D, E, F, and G) Pupil measures and subjective effort ratings for each condition, averaged over SNR and participants. Error bars indicate the standard error of the mean.

