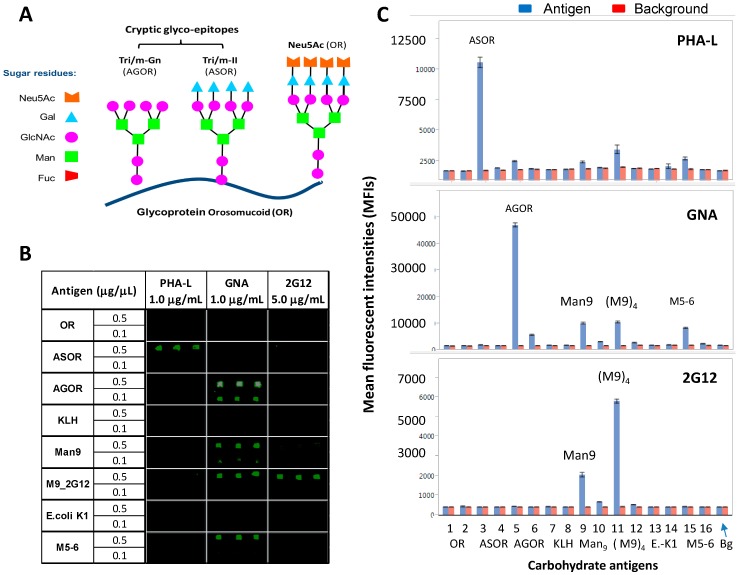
Figure 2.
A comparative microarray analysis of the glyco-epitopes that are recognized by PHA-L, GNA, and 2G12. (A) Schematic of N-glycan “cryptic” glyco-epitopes, Tri/m-II and Tri/m-Gn, that are displayed by autoantigen, ASOR and AGOR, respectively; (B) Microarray images of PHA-L, GNA, or 2G12 staining against autoantigens, OR, ASOR, AGOR, Man9, (M9)4, and Ribonuclease B, which predominately express Man5 and Man6 (M5-6), as well as control probes, KLH, and E. coli K1. Importantly, GNA binds to AGOR but not to ASOR or OR; and (C) Microarray datasets for PHA-L (Upper), GNA (Middle), and 2G12 (Bottom), respectively. Each antigen was spotted in triplicate at given concentrations as specified. Results were compared using overlay plots of the MFIs of staining signal (blue bars) versus those of local backgrounds surrounding the antigen microarrays (red bars).

