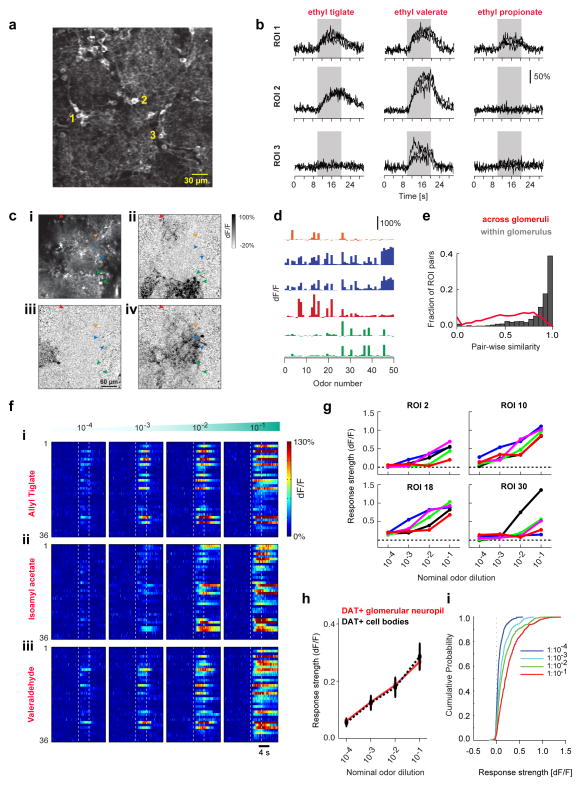
Figure 2. Responses of individual DAT+ cells are odor specific and scale with stimulus concentration.
A. Two-photon image showing average resting fluorescence of a FOV from a DAT-Cre mouse x Ai38 reporter mouse line. Numbers denote representative DAT+ cell bodies.
B. GCaMP3.0 signals (dF/F) of DAT+ cells shown in A to Ethyl tiglate, Ethyl valerate and Ethyl propionate at 10−2 oil dilution. Black traces indicate individual trials. Gray band indicates odor presentation.
C. Two-photon images from a FOV showing average resting fluorescence (i) and odor evoked dF/F responses (ii–iv) of GCaMP3.0 labeled DAT+ cells around several glomeruli to 2,4,5-trimethyl thiazole (ii), 2-hexanone (iii) and Isobutyl propionate (iv). Fiduciary marks indicate cell bodies. Same color arrows indicate DAT+ cells selected around the boundaries of the same glomerulus.
D. Odor Response Spectra (ORS) of the DAT+ cells marked in c (i) to a panel of 50 odors. Colors indicate putative sister DAT+ cells.
E. Distribution of ORS similarity for all cell (ROI) pairs within individual FOVs. Gray bars and red line show similarity of ORS corresponding to DAT+ cell bodies selected around the same glomeruli (1,390 pairs; average similarity 0.86±0.005) and randomly across (9,845 pairs; average similarity 0.56±0.003) glomeruli respectively. 331 ROIs, 50 odors, 4 mice.
F. GCaMP3.0 signals (dF/F) from 59 DAT+ cells to increasing concentrations of Isoamyl acetate, Valeraldehyde and Heptanal within the same FOV. Color indicates normalized change in fluorescence with respect to pre-odor baseline. Dotted lines mark odor presentation.
G. Mean odor response (5 repeats) of four example DAT+ cells in F to increasing concentrations of Allyl tiglate (blue), Isoamyl acetate (cyan), Valeraldehyde (green), Ethyl valerate (magenta) and Heptanal (red).
H. Mean of odor response from all glomerular ROIs selected (red) and for individual DAT+ cell bodies (dotted black) across five odors, at 4 different concentrations. 34 glomerular ROIs, 110 DAT+ cells in 3 mice.
I. Cumulative distribution of DAT+ cells’ odor responses across 4 concentrations (n = 110 DAT+ cells, 3 mice).

