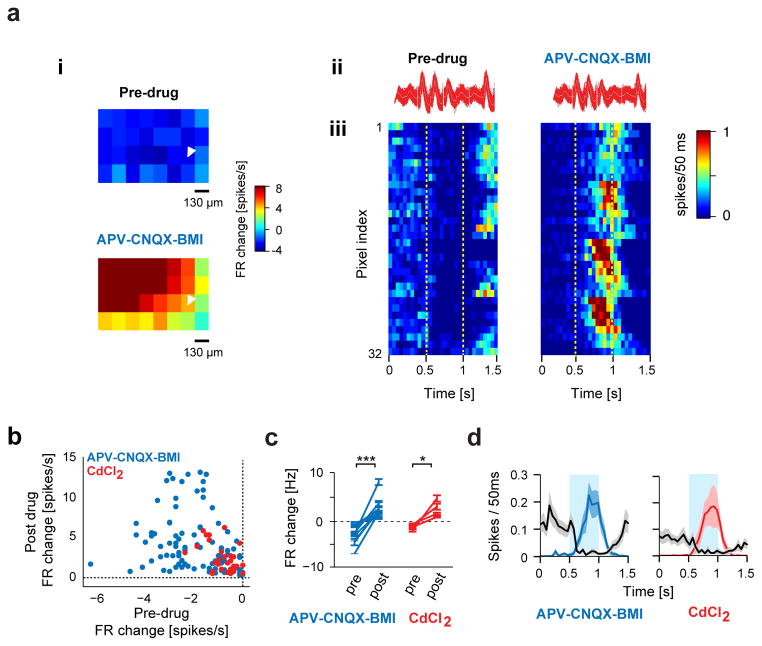
Figure 5. Light-induced suppression of M/T cells by DAT+ cells switches to excitation in presence of synaptic blockers.
a. (i) Spike waveforms of an example M/T unit from a DAT-Cre mouse injected with DIO-ChR2-EYFP AAV virus before (left) and after (right) application of drugs. (ii) Example M/T unit shown in (i) showing change in firing upon mapping the OB surface with blue light spots (130 μm × 130 μm, 15 mW/mm2, 15 repeats) before (top) and 30 min after (bottom) bath application of synaptic blockers (APV-CNQX-BMI). Color indicates percentage change in firing with respect to pre-light stimulation baseline. (iii) PSTHs of all spots from the light mapping session in (i), before (left) and after (right) drug application. Pixels, from bottom left to top right corner, in the light map are re-ordered as top to bottom rows in the PSTH. Dotted lines indicate light stimulus. Color indicates firing rate in each 50 ms bin. Fiduciary mark shows location of recording electrodes.
B. Scatter plot showing light-evoked change in firing rate of 15 M/T units during control and drug conditions. Each dot corresponds to a light stimulation spot that significantly modulated firing of the recorded M/T unit in the control condition. Blue and red dots correspond to APV-CNQX-BMI (92 spots, 11 M/T units) and CdCl2 (32 spots, 4 M/T units) conditions respectively. Significance was tested using a paired t-test for all spots shown before and during drug application (blue dots, p < 0.001) and CdCl2 (red dots, p < 0.001).
C. Summary plot showing light-evoked change in firing rate of all M/T units before and during APV-CNQX-BMI (blue, 11 M/T units, 4 bulbs) and CdCl2 (red, 4 M/T units, 2 mice) application. * p < 0.05, *** p < 0.001, paired t-test.
D. Average time-course of firing rate of all recorded M/T units before (black) and during application of APV-CNQX-BMI (blue) or CdCl2 (red). Only spots that significantly modulated the M/T firing rate in the control condition were included. Shaded bands indicate SEM across M/T units.

