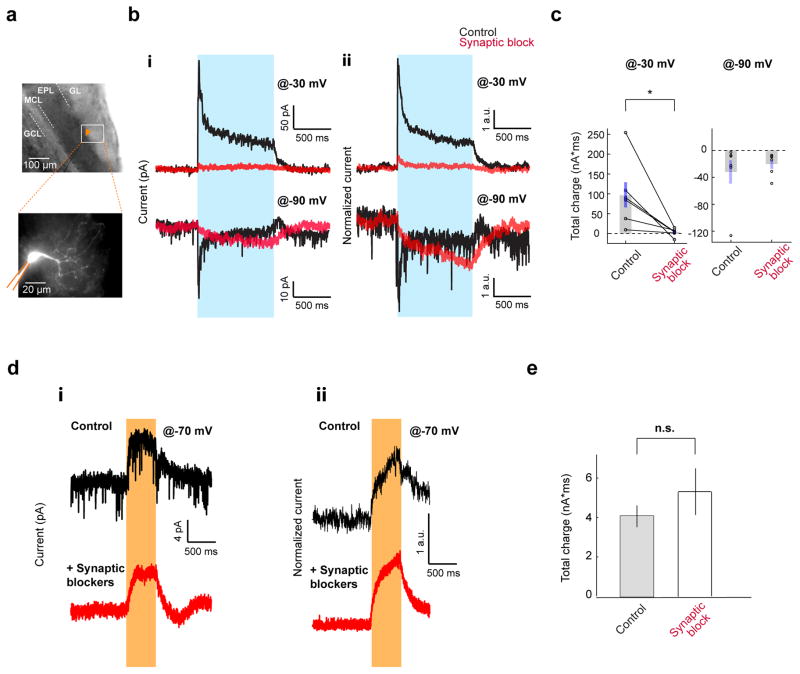
Figure 6. DAT+ cells interact with ET cells through both chemical and electrical synapses.
A. Whole cell recordings from ET cells upon full-field activation of ChR2 expressing DAT+ cells in acute horizontal OB slices. Top, Image of the patch pipette (fiduciary mark) recording from an ET cell in the GL. Bottom, Typical morphology of an ET cell filled with Alexa 594 fluorescent dye.
B. Voltage clamp recordings from ET cells as above. (i) Top, Application of synaptic transmission blockers abolishes the light-induced outward current at −30 mV holding potential in a representative ET cell. Black and red traces (average of 10 repeats) represent trials pre- and post-drug application respectively. Blue bar indicates light stimulation. Bottom, in the same ET cell, the light-induced current reverses polarity at −90 mV holding potential (black trace, average of 10 repeats). Application of synaptic blockers (red trace, average of 10 repeats); (ii) Average of light-induced currents of 6 ET cells at −30 mV (top) and −90 mV (bottom) holding potentials, before (black) and after (red) pharmacological block of synaptic transmission. Currents from individual cells are normalized by the average current during the pre-drug light period.
C. Summary of total light-induced charge in ET cells shown in B before and after pharmacological block of synaptic transmission. Average light-induced total charge at −30 mV before (98±32 nA*ms) and after synaptic block (3.2±3.7 nA*ms) was significantly different (n = 6 cells, p = 0.037, paired t-test). Average light induced total charge at −90 mV was −32±18 nA*ms and −20±6 nA*ms before and after synaptic block respectively (n = 6 cells).
D. Voltage clamp traces (−70 mV holding potential) from ET cells upon full-field inactivation of NpHR3.0 expressing DAT+ cells. (i) In an example ET cell, yellow light induces an outward current (top, average of 10 repeats), which persists in the presence of synaptic blockers (bottom, average of 10 repeats). (ii) Average light-induced currents across ET cells in the absence (top, n = 8) or in the presence of synaptic blockers (bottom, n = 12). Currents from individual cells are normalized by the average current during the light period.
E. Total light-induced charge at −70mV holding potential in the ET cells in the absence (4.1±0.55 nA*ms, n = 8 cells) and presence (5.3±1.2 nA*ms, n = 7 cells) of synaptic blockers (p = 0.37, two-sample unpaired t-test).

