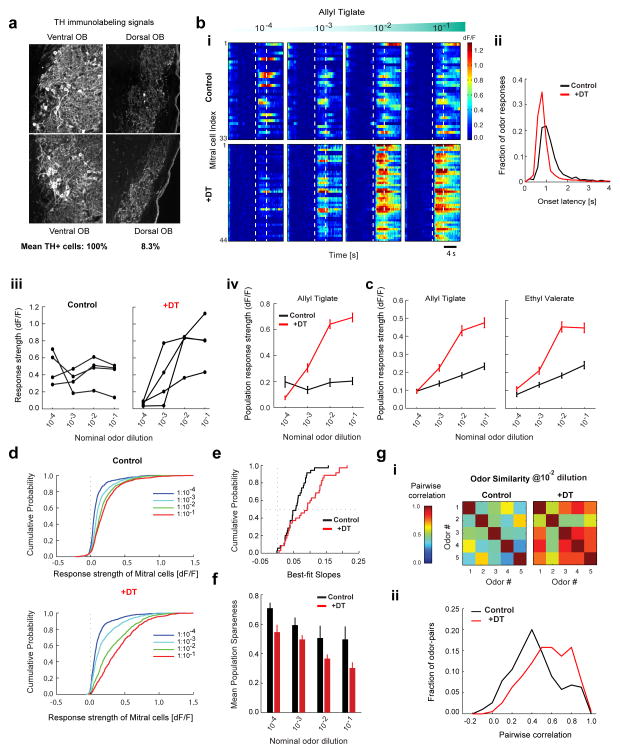
Figure 7. DAT+ cells implement gain control and decorrelate mitral cell odor responses.
A. TH+ immunohistochemistry in the olfactory bulb of a DAT-Cre x Thy1-GCaMP3.0 mouse injected with AAV2.9-FLEX-DTR-GFP virus on the dorsal aspect of the OB followed by diphtheria toxin (DT) intraperitoneal injection. Confocal images of TH+ signal in two representative FOVs on the ventral (left) and dorsal (right) aspect of a given slice. Average counts of TH+ cells from all dorsal FOVs and from all ventral FOVs on in DTR injected mice, normalized by the number of visible glomeruli (100% for control and 8.3% for +DT, n = 1,259 cells, 8 FOVs, 2 mice). Residual signals mostly consisted of neuropil.
B. Baseline-subtracted, normalized GCaMP3.0 ensemble mitral cell responses to increasing concentrations of Allyl tiglate. (Top) DAY 0 before injection of DT (control, n = 33 cells). (Bottom) Different FOV in the same OB on DAY 7 after DT injection (+DT, n = 44 cells). Each row represents an individual mitral cell (ROI) in the same FOV. Color indicates (dF/F). Dotted lines indicate odor presentation (4 s).
C. (i) Distribution of onset latencies of mitral cell odor responses for control (1.55s ± 1.51s, n = 3660 cell-odor pairs) and +DT condition (1.2s ± 1.39s, n = 3000 cell-odor pairs). Numbers denote mean and standard deviation. Both the mean (two-sample t-test, p < 10−18) and the variance (F-test, p < 10−5) are significantly smaller in the +DT condition. (ii) Odor-evoked response (dF/F) of four example mitral cells from B, as a function of odor concentration. (iii) Mean odor-evoked response (dF/F) of all mitral cells from B as a function of odor concentration for Allyl tiglate on DAY 0 (black, n = 33 cells) and DAY 7 after +DT administration (red, n = 44 cells).
D. Mean odor-evoked response (dF/F) of all mitral cells pooled across experiments as a function of odor concentration for Allyl tiglate and Ethyl valerate. Concentration response curves are shown for control (black, n = 168 cells, 7 FOVs, 7 mice) and +DT conditions (red, n = 150 cells, 7 FOVs, 3 mice).
E. Cumulative distribution of odor response strength of all mitral cells pooled across experiments, to five odors as a function of concentration in the control condition (n = 168 × 5 cell-odor pairs for each concentration) and after +DT injection (n = 150 × 5 cell-odor pairs for each concentration).
F. Cumulative distribution of slopes of the ensemble mitral cell concentration response curves separately fitted for each FOV and odor, in the control and +DT conditions (n = 35, 7 FOVs X 5 odors).
G. Population sparseness of mitral cell odor representations for each concentration in the control (black, n = 168 cells, 7 FOVs) and +DT conditions (red, n = 150 cells, 7 FOVs). Each bar denotes the mean population sparseness for 5 odors at each concentration.
H. (i) Matrix of correlation coefficients between the neural response spectra (length of vector = # of recorded neurons) for each odor pair at 1:100 dilution in the control and +DT conditions. (ii) Distribution of pairwise correlation coefficients between all stimulus pairs (n = 190 pairs, 5 odors at 4 concentrations) in the control and +DT conditions.

