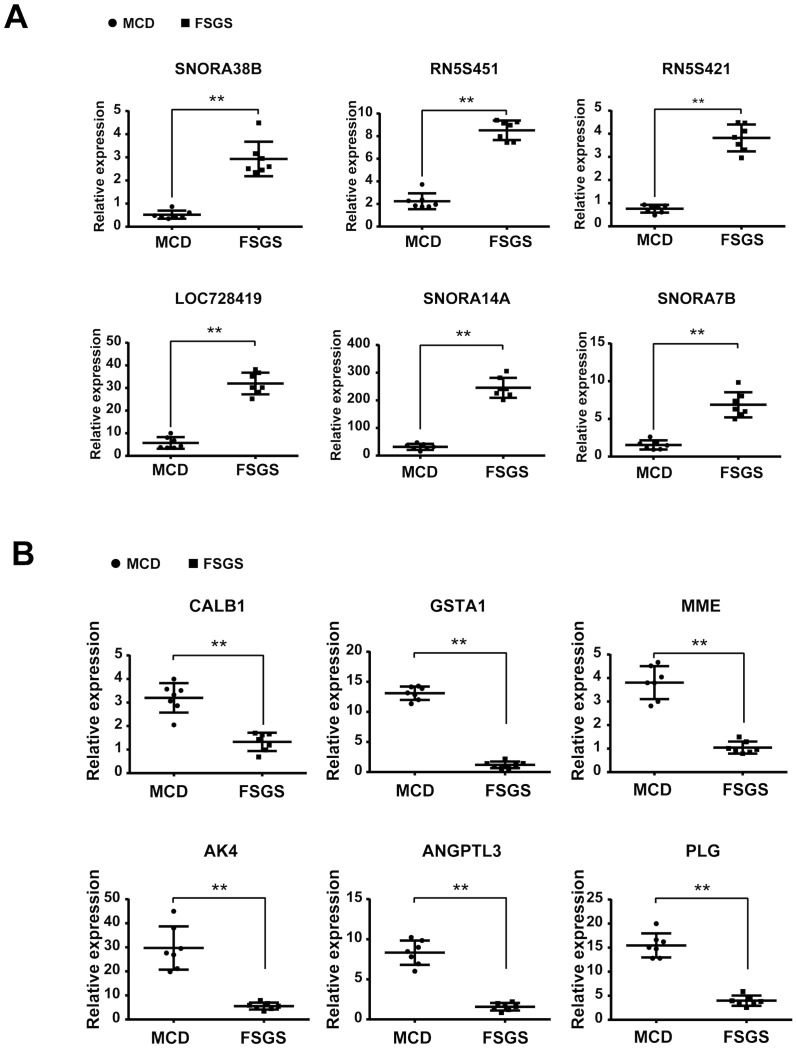
Fig 7. Validation of the top 6 genes up-regulated and the top 6 genes down-regulated in FSGS patients compared with MCD patients using real-time PCR in glomerular transcriptomes.
(Student's t-test or Mann-Whitney U test was used to compare the continued variables based on their distributions.**P < 0.01, FSGS patients compared with MCD patients). A, Validation of the top 6 genes up-regulated; B, Validation of the top 6 genes down-regulated.

