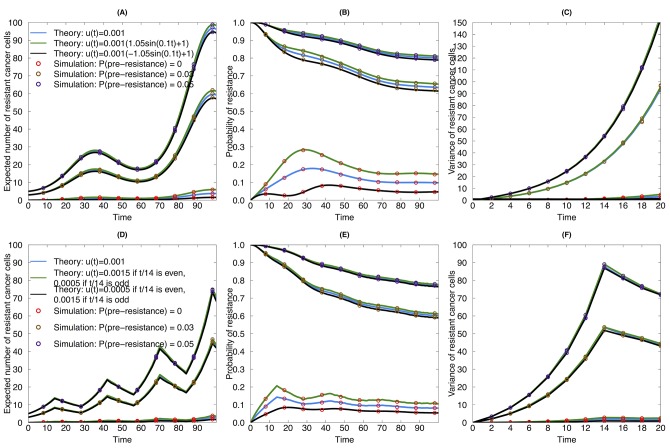
Fig 3. Evolutionary dynamics of sensitive and resistant clones during continuous therapy with pre-existing resistant cells.
(A), (B) and (C) are examples for sine wave functional forms of birth, death and mutation rates. (A) Expected number of resistant cancer cells as a function of time during continuous therapy. Blue line: mutation rate is constant during treatment; black line: mutation rate increases with drug dose; green line: mutation rate decreases with drug dose. Red circles: simulation results for no pre-existing resistant clones; orange circle: simulation result for 3% proportion of pre-existing resistant clones; purple circle: simulation result for 5% proportion of pre-existing clones. (B) Probability of resistance as a function of time during continuous therapy. (C) Variance of resistant cancer cells as a function of time during continuous therapy. (D), (E), and (F) are examples for piecewise functional forms of birth, death and mutation rates. (D) Expected number of resistant cancer cells as a function of time during continuous therapy. (E) Probability of resistance as a function of time during continuous therapy. (F) Variance of resistant cancer cells as a function of time during continuous therapy. The death rates in Fig 2 were used here as the death rates for both upper and lower panels. The birth rates in the continuous therapy in Fig 2 were also used in this figure. The birth rates in the piecewise strategy were λ Xs(t) = 0.15⋅I(t / 14 mod 2 = 0) + 0.05⋅I(t / 14 mod 2 ≠ 0), λ Xr(t) = 0.17⋅I(t / 14 mod 2 = 0) + 0.07⋅I(t / 14 mod 2 ≠ 0).

