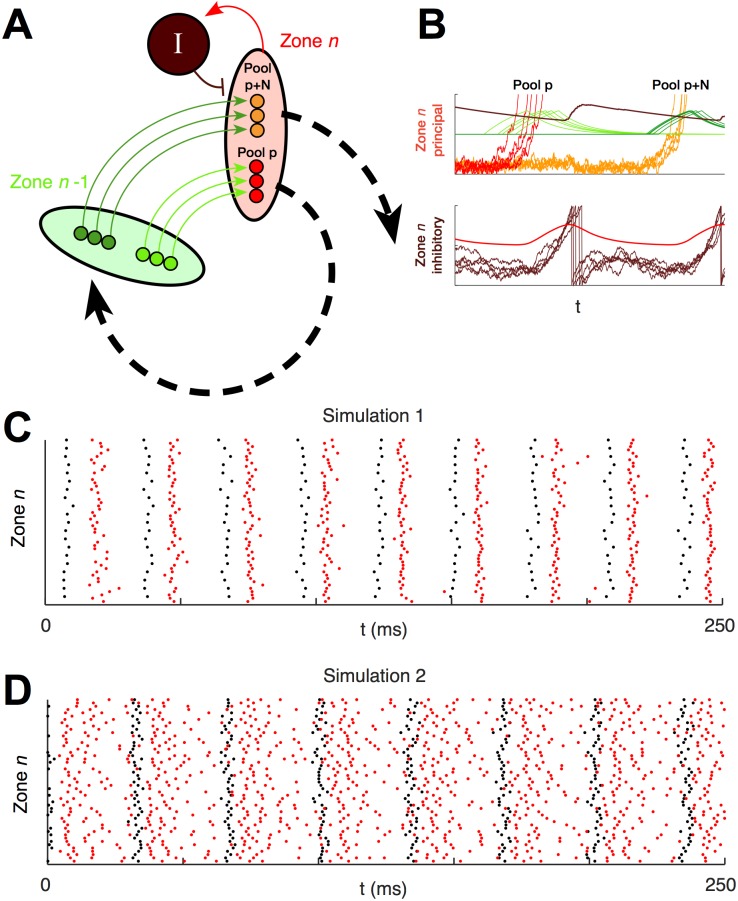
Fig 4. Local temporal coordination between an excitatory pulse and feedback inhibition.
A, Schematic illustration of two zones of the network. B, Voltage and current traces from simulation 1 with feedback inhibition. Above, voltages of principal cells m = 1, …, 5 in pools p and p + N in zone n, their respective afferent EPSCs and , and local inhibition ϕ n are displayed on the same unit-less y-axes ranging from −1 to 1. Below, voltages of inhibitory cells m = 1, …, 5, in zone 0 and their afferent excitation are similarly displayed. Colors correspond to the schematic in A. On the upper axes, bright red is for all cells m in pool p; orange is the same for pool p+N; light green is the EPSPs created in pool p by cells in pool p-1; dark green is the EPSPs created in pool p+N by cells in pool p+N-1; and dark red is gieϕn, the level of local I-to-E inhibition. On the lower axes, dark red is for all inhibitory cells m in zone n, and bright red is the net E-to-I excitation affecting these cells. Principal cell spiking in pool p excites local inhibitory cells, which respond by spiking and elevating levels of inhibition to the local principal cells. The next local pool, pool p + N, spikes when the excitatory pulse has circled the network and returned. The pulse arrives as the local inhibition decays. C, A spike raster from one zone in simulation 1 with feedback inhibition shows local alternation of volleys of principal cell spikes (black) and volleys of inhibitory spikes (red). D, A spike raster from one zone in simulation 2 with feedback inhibition shows local inhibitory spiking (red) continuing throughout the simulation, with periodic volleys of local principal cell spikes (black) alternating with periods of increased inhibitory firing rate.

