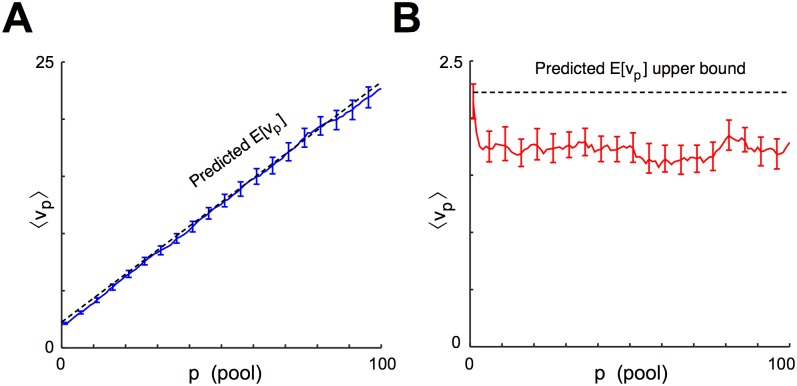
Fig 9. Simulation results match analysis predictions.
A, For 100 repetitions of simulation 1 without feedback inhibition, the mean ⟨v p⟩ is calculated across trials and plotted against p, and error bars representing 10%–90% confidence intervals are calculated for every fifth pool by case resampling. The rate of increase of ⟨v p⟩ closely matches the theory (dotted line) except in the first few pools, where the effect of initializing all voltages from zero may have artificially decreased the observed level of synchrony. B For 100 repetitions of simulation 1 with feedback inhibition, ⟨v p⟩ is plotted with error bars representing 1%–99% confidence intervals calculated by case resampling. From pool 6 on, confidence intervals remain below the upper bound for estimated by our analysis (dotted line).

