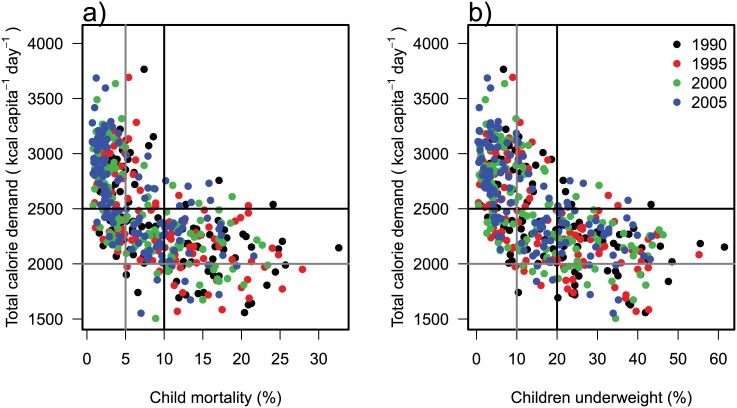
Fig 8.
Percentages of child mortality (a) and children underweight (b) against food demand for 4 years (denoted by colors). Data are taken from Von Grebmer et al. [49] and FAOSTAT [1]. Lines indicate the thresholds for calorie demand of 2000 and 2500 kcal capita−1 d−1, child mortality percentages of 5 and 10% and children underweight percentages of 10 and 20%.

