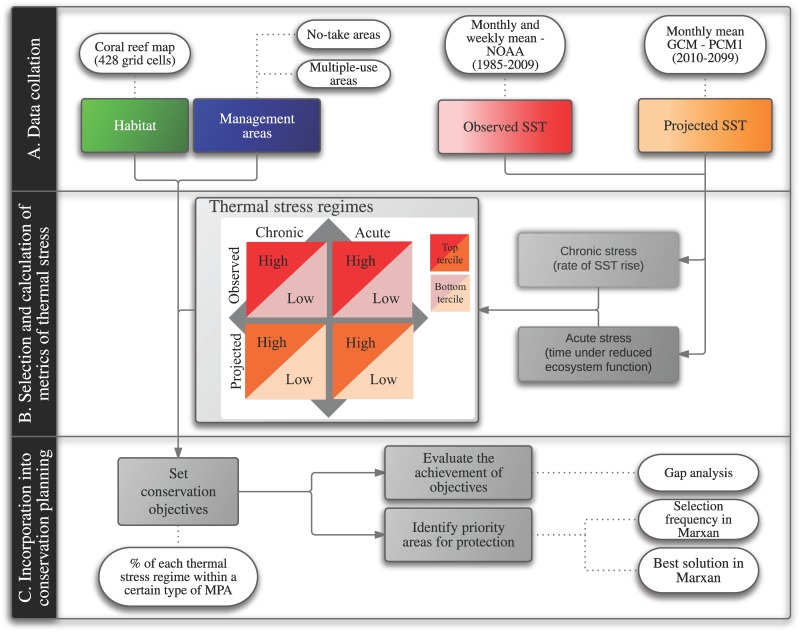
Fig 1. Methods of this paper divided into three major phases.
(A) Data collation involved acquisition of habitat data (green box), boundaries of marine protected areas (MPAs) (blue box), and observed and projected data (red and orange boxes, respectively) on sea-surface temperature (SST). In the selection and calculation of metrics of thermal stress (B), we derived metrics of chronic and acute stress from observed and projected datasets and combined them to define thermal-stress regimes. Regimes were delineated based on upper and lower terciles labelled as “high” (highest 33% of values, dark red or orange) and “low” (lowest 33% of values, light red or orange), respectively. The incorporation of warming disturbances into conservation planning (C) consisted of setting conservation objectives for each thermal-stress regime, evaluating their achievement in existing MPAs, and identifying priority areas that would achieve unmet objectives. Arrows in gray indicate the flow of information and lighter boxes linked by dashed lines depict types of data or analyses involved in each step.

