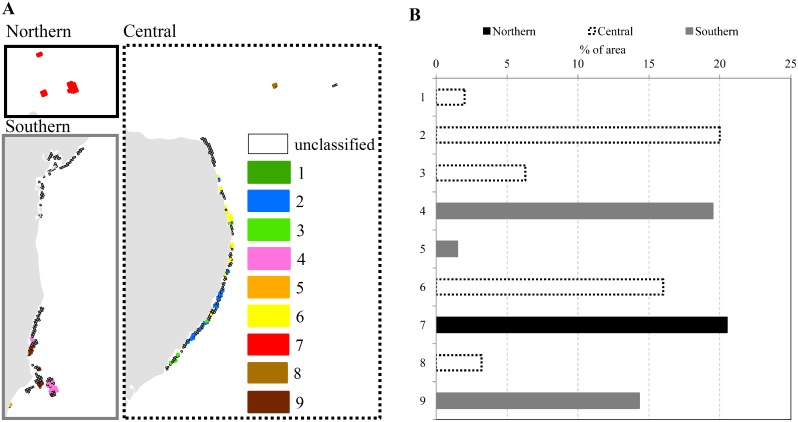
Fig 8. Distribution of thermal-stress regimes across study area.
(A) Reef cells to which the nine regimes were allocated. Empty (black outlined) cells are unclassified because they have middle-tercile values for at least one of the four variables used to classify regimes. Labels for thermal regimes match those in Fig 4. Views for reefs in the northern, central, and southern sectors correspond to insets in Fig 2A. (B) Areal coverage of each thermal-stress regime as a percentage of the total of all reef cells allocated to regimes (n = 101). Each regime was encapsulated within a single sector.

