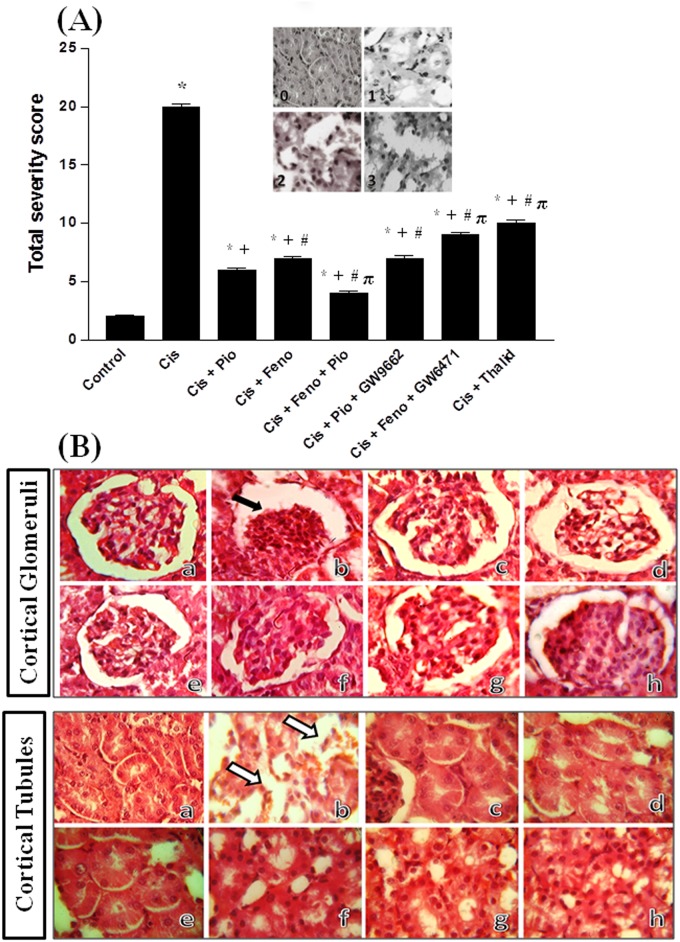
Fig 1.
Panel A, the total severity score for tubular damage obtained from H&E stained kidney sections (×400): score 0: normal histology, score 1: tubular cell swelling, brush border loss with up to 1/3 of the tubular profile showing nuclear loss, score 2: from 1/3 to 2/3 of the tubular profile showing nuclear loss, and score 3: more than 2/3 of the tubular profile showing nuclear loss. Shown also in panel A the graphical presentation of the total severity score for tubular necrosis of different treated groups. *, +, # and π denote significant difference (P<0.05) vs. control, cisplatin, cisplatin+pioglitazone and cisplatin+fenofibratevalues, respectively. Panel B, hematoxylin and eosin stained photomicrographs (×100 and ×400) of kidneys obtained from rats treated with saline (control, image a), cisplatin (5mg/kg, i.p., image b), cisplatin+pioglitazone (2.5 mg/kg/day, orally, image c), cisplatin+fenofibrate (100 mg/kg/day, orally, image d), cisplatin+pioglitazone+fenofibrate (e), cisplatin+pioglitazone+GW9662 (1 mg/kg/day, i.p, image f), cisplatin+fenofibrate+GW6471 (1 mg/kg/day, i.p, image g) and cisplatin+thalidomide (12.5 mg/kg/day, i.p, image h). The black arrow shows glomerular atrophy whereas white arrows point to acute tubular necrosis, marked dilation of proximal convoluted tubules with vacuolation.

