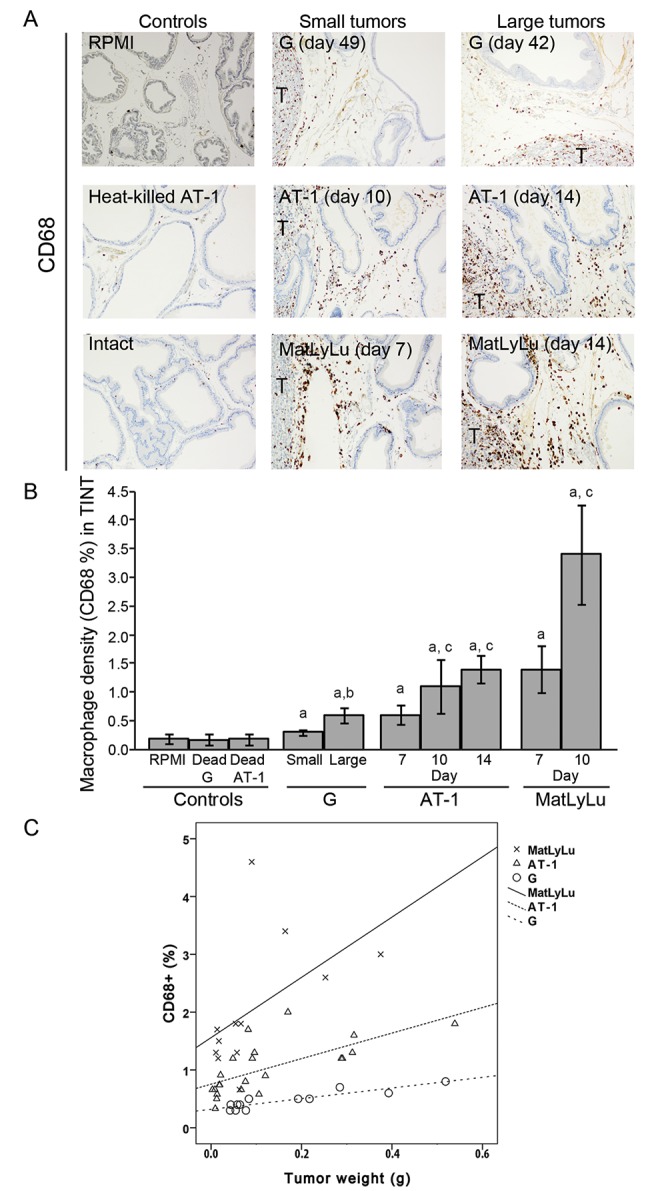
Fig 1. (A) Representative sections from the ventral prostate lobe of Dunning tumor-bearing and control rats stained to visualize CD68+ macrophages (brown, 200X magnifications, T; tumor). (B) Volume density of CD68+ macrophages in the tumor-adjacent prostate tissue (TINT) and in controls. a; significantly different than controls, b; large G tumors significantly different than small G tumors, and c; significantly different than corresponding tumor at day 7, P<0.05, n = 5–13. (C) Scatterplot of the volume density of CD68+ macrophages in the tumor-bearing organ plotted against tumor weight (correlation coefficients are given in the result text).

The density of macrophages increases with tumor size, but MatLyLu (X) tumors attracted more macrophages than AT-1 (Δ) and G (O). Correlation coefficients are given in results section.
