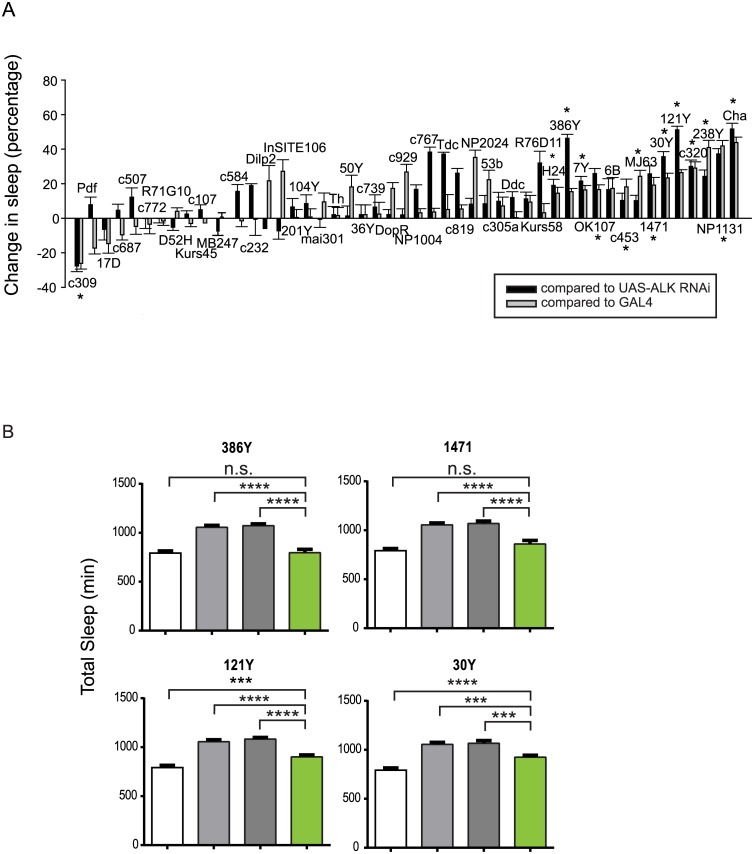
Fig 4. Alk is required in a subset of CNS neurons to regulate sleep.
A) A targeted Alk RNAi screen with CNS Gal4 drivers to identify regions where ALK acts to regulate sleep. The graph shows the percentage changes in total sleep as a result of expressing Alk RNAi compared to controls UAS-Alk RNAi/+; Dcr2/+ (black bars) and Gal4/+ (grey bars). The difference in sleep amount between the experimental group and each control group was divided by the amount of control sleep to calculate net percentage change. Bars represent pooled data from 2–4 experiments for each genotype and show means ±SEM (n = 8–58 for experimental groups and each Gal4 control group. N = 131 for the UAS-Alk RNAi control). Daily sleep was averaged over 3 days. One-way ANOVA and post hoc analysis were done to compare total sleep in the Alk RNAi-expressing group to UAS-Alk RNAi and Gal4 control groups. * indicates that total sleep of the RNAi expressing group is significantly different from those of both control group. B) The long sleep phenotype of Alk ts at the restrictive temperature can be rescued by expressing Alk in sub-regions of the brain. Genotypes for the four bars: iso31 (white), Alk ts, UAS-Alk/Alk ts; Tub-Gal80 ts/+ (light grey), Alk ts ; Gal4/+ (dark grey), Alk ts, UAS-Alk/Alk ts; Gal4/tub-Gal80 (green). The white and light grey controls are the same in these graphs. N = 21–46. Total sleep amounts were averaged for 3 days at 29°C. One-way ANOVA and post hoc Turkey’s test were performed for all pairwise comparisons. In all groups, grey bars (Alk ts controls) are significantly higher than the white bar (****p<0.0001), which is not indicated in the graph.

