
Figure 8.
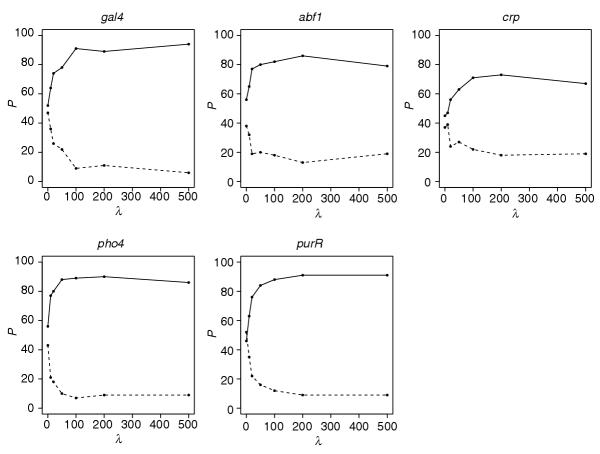
λP plots for the variable change point model using the L2 prior. In all λP plots, the solid line shows the percentage of simulated datasets where at least 50% of the real sites were correctly identified. The dashed line shows the percentage of simulated datasets where at least 50% of the permuted sites were identified. We use the following model specifications: W = 17 and bimodal for gal4; W = 12 and bimodal for abf1; W = 16 and bimodal for crp; W = 10 and unimodal for crp; and W = 20 and unimodal for purR.