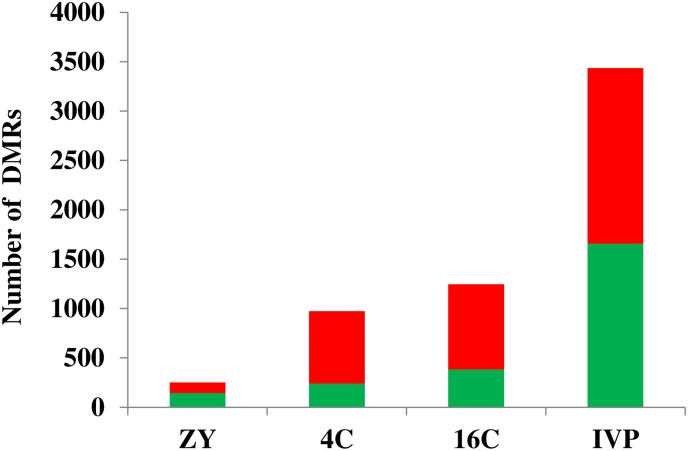
Fig 1. Differentially methylated regions (DMRs) in ZY, 4C, 16C and IVP blastocyst groups.
Red and green bars indicate the number of hypermethylated and hypomethylated genomic regions, respectively. The magnitude the DMRs stretched between 1.5 and 2.3 absolute fold changes in ZY and 4C groups, between 1.5 and 4.6 in the 16C group and between 1.5 and 2.6 folds in IVP group with reference to VO group.

