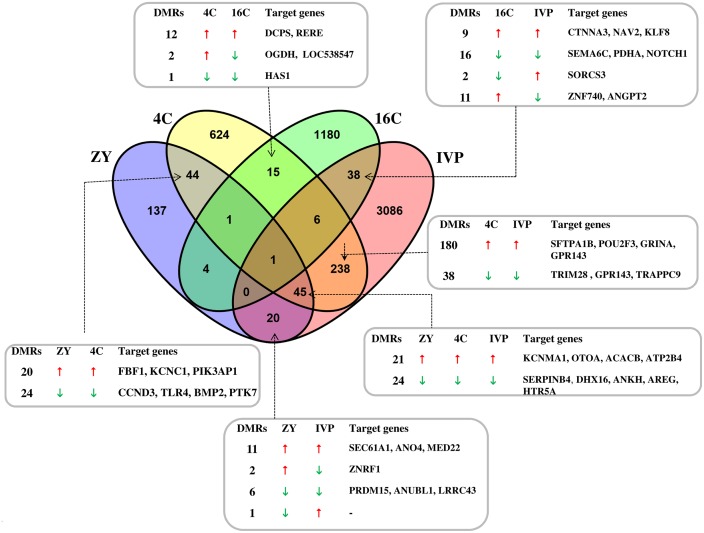
Fig 3. Venn diagram depicting differentially methylated genomic regions specific in ZY, 4C, 16C or IVP blastocyst group or genomic regions stably hypermethylated or hypomethylated in two or more blastocyst groups.
Symbols, ↑ and ↓ indicate hypermethylation and hypomethylation, respectively. DMRs = the number of differentially methylated regions. The gene lists under the column target genes indicate only representative ones.

