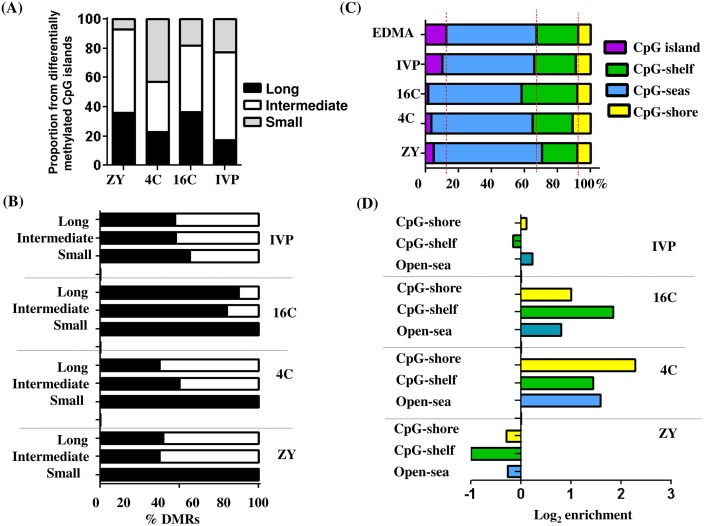
Fig 4. Differentially methylated CpG islands in ZY, 4C, 16C and IVP blastocyst groups.
(A), The relative proportion of long, short and intermediate CpG islands with respect to the total differentially methylated CpG islands. (B), The relative proportion of hypermethylated or hypomethylated small, long and intermediate CpG islands in ZY, 4C, 16C and IVP blastocyst groups. Black and white bars indicate hypermethylation and hypomethylation, respectively. (C), The relative proportion of CpG islands and non-CpG islands with respect to the total probeset (EDMA array) or relative to the total differentially methylated probes. The red dotted line represents the baseline of the ratio when all probes are taken into account. The probe is assumed to be in CpG shore, CpG shelves and Open Sea if the fragment the probe is located 1–2 kbp, 2–4 kbp and > 4 kbp away from the nearest CpG island, respectively. (D), Enrichment ratios of hypermethylated non-CpG islands DMRs with respect to their distance to the nearest CpG islands. Positive log2 enrichment indicates increased proportion of hypermethylated region and negative log2 enrichment values depict higher proportion of hypomethylated genomic regions at Open-Sea, CpG-shore or CpG-shelf.

