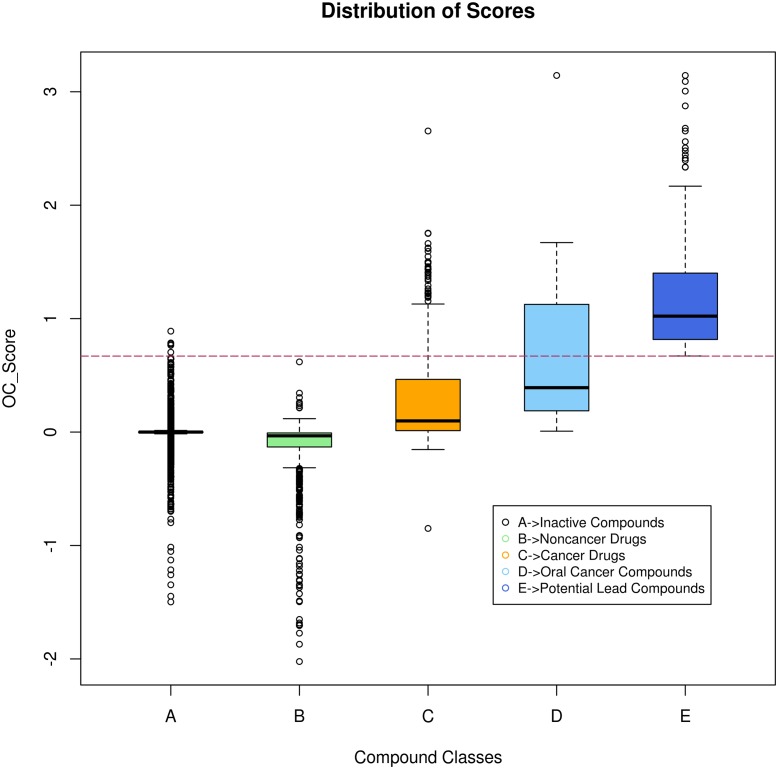
Fig 7. Distribution of oral cancer specific statistic ‘OC_Score’.
Box-plots depicting score distribution of compounds belonging to different groups, compared with those identified as potential compounds for oral cancer treatment. Horizontal line indicates the cutoff used in the current study to select potential compounds.

