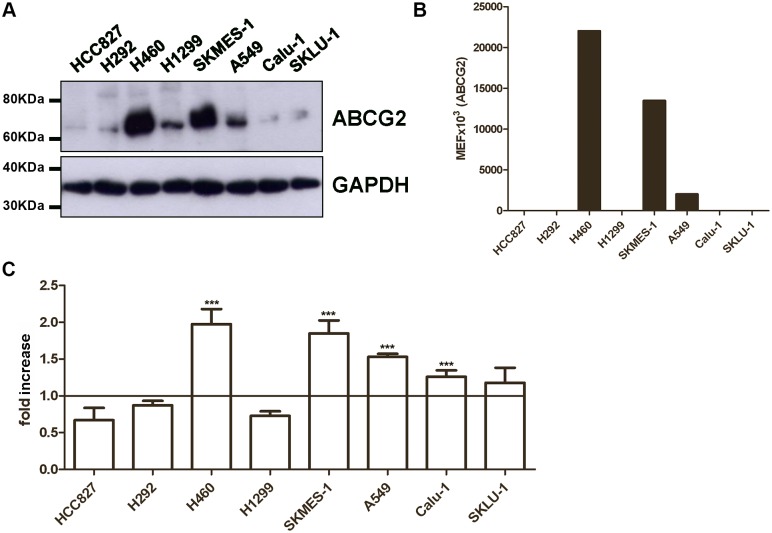
Fig 1. Characterization of ABCG2 expression and activity in NSCLC cell lines.
(A) Cells were lysed and 50μg of proteins loaded to assess ABCG2 protein expression by western blot analysis. Data are from a representative experiment. Each experiment, repeated three times, yielded similar results. (B) ABCG2 protein levels on cell surface were quantified by flow-cytometry and expressed as molecular equivalent of fluorochrome (MEF) as described in the Methods Section. (C) Cells were loaded with 1 μM Hoechst 33342 in the presence or in the absence of 10 μM Fumitremorgin C. After 4 hours of incubation, Hoechst 33342 was removed and its fluorescence was determined by luminometer. Relative ABCG2 activity was defined as the ratio of Hoechst 33342 accumulation per μg of protein between Fumetrimorgin C treated cells and untreated cells and was expressed as fold increase. The mean values of three independent measurements (± SD) are shown (***P < 0.001).

