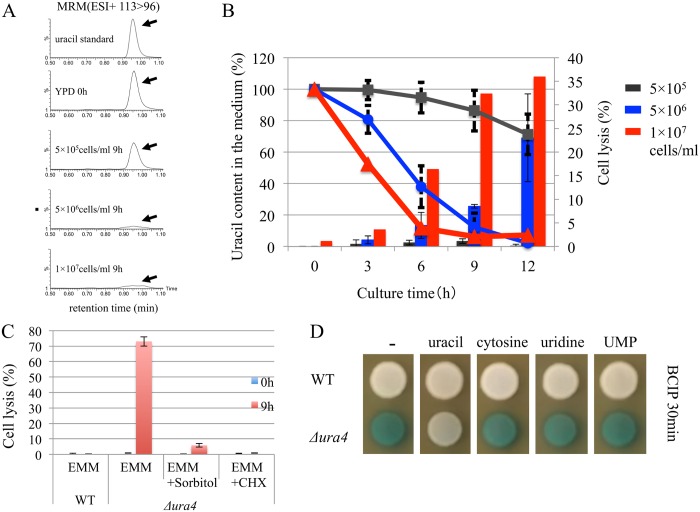
Fig 6. Induction of cell lysis by uracil starvation.
(A) UMP31 (Δura4) cells were grown in YES medium for 12 h. Cells were washed twice with sterile water and then grown in YPD medium at initial cell counts of 5 × 10⁵, 5 × 10⁶, or 1 × 10⁷ cells/ml. The chromatography of LC-MS data (MRM (ESI+ 113>96)) obtained at 0 and 9h are shown as representatives. Arrows show uracil peaks. (B) All data of uracil concentration measured by LC-MS are plotted in the graph. The uracil concentration in the medium (lines) and the extent of cell lysis (bars) were measured after 0, 3, 6, 9, and 12 h of incubation (right). Error bars indicate standard deviation. (C) L972 (ura4 +) and UMP31 (Δura4) cells were grown in YES medium for 12 h, washed twice with sterile water, and suspended in EMM medium with or without CHX (100 μg/ml) or 1 M sorbitol and incubated at 30°C. Cell lysis was measured after 0 and 9 h of incubation. Error bars indicate standard deviation. (D) Wild-type and Δura4 cells were grown in YES medium for 12 h. Cells were then spotted on YPD containing uracil, cytosine, uridine, or UMP (each 300 mg/l) and incubated at 30°C for 3 days. For the alkaline phosphatase assay, BCIP was used as described in Fig 1.

