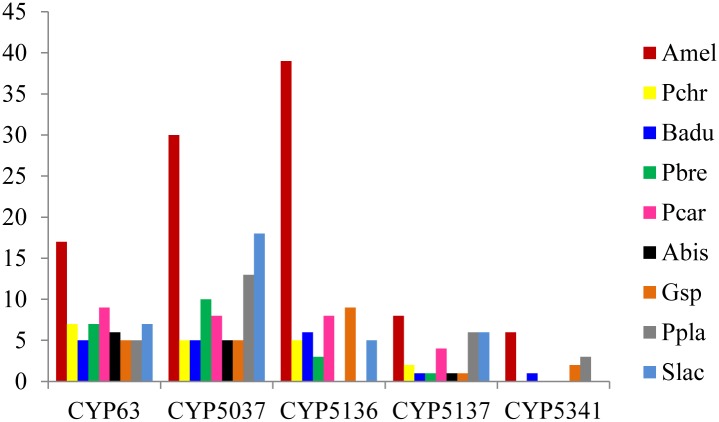
Fig 4. Comparative analysis of putative representatives of enriched P450 families in Agaricomycotina species.
The member count in the P450 families that are expanded in A. mellea is compared with the member count of the same families present in Agaricomycotina saprophytes. The X-axis represents the P450 count and the Y-axis represents P450 families.

