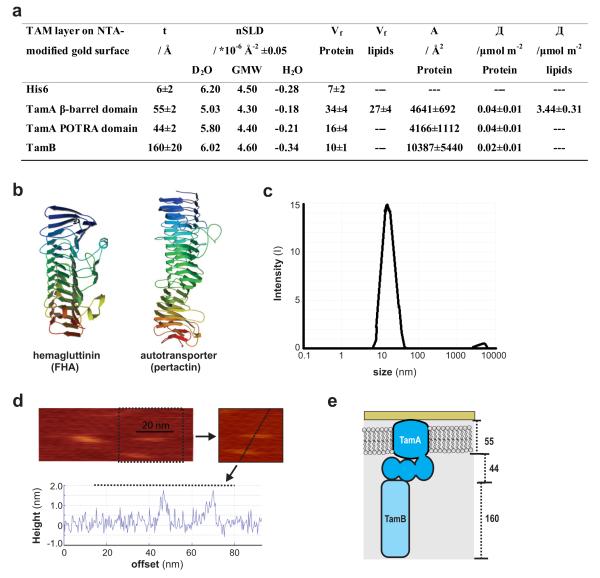
Figure 4. Reconstitution of the TAM.
(a) Fitted MCNR data measurements of TamB docking to the TamA layer: the volume fraction (Vf) of both TamA β-barrel and POTRA domains are derived from six contrasts (Supplementary Fig. 5). After addition of TamB, further measurements made are detailed in Supplementary Fig. 6. The parameters of the reconstituted TAM are calculated using six contrasts. t: thickness, nSLD: scattering length density, Vf: volume fraction, A: area per molecular, Γ: surface excess. Where indicated, ± denotes the standard deviation. (b) Structures of two β-helical bacterial proteins, the hemagglutinin FHA (pdb code 1RWR) and the passenger-domain of the autotransporter pertactin (pdb code 1DAB). (c) Dynamic light scattering result for the soluble preparation of TamB. (d) Solution AFM imaging of TamB on a mica surface (scale bar 20 nm). Cross-sectional data corresponding to the dashed line is shown below the images. (e) Pictorial representation of the TAM based on MCNR and AFM data.

