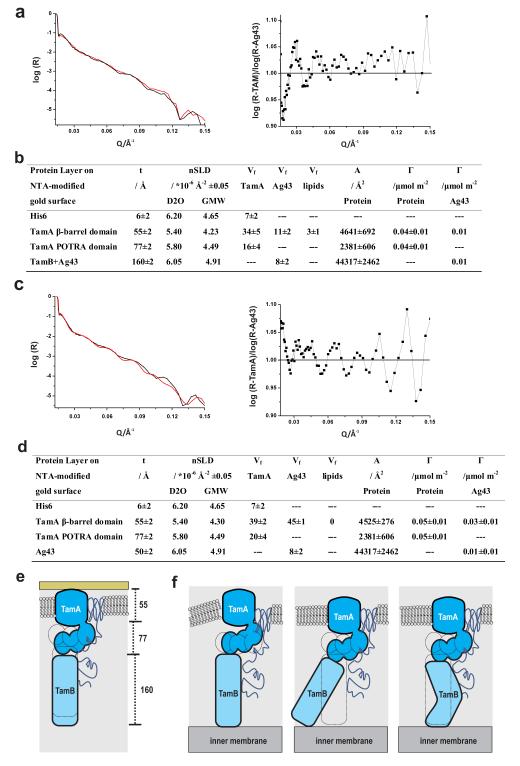
Figure 5. Dynamics of the TAM measured in response to substrate binding.
(a) MCNR curves of the TAM with addition of Ag43 (left panel): responses prior to addition of Ag43 (black) and after addition of Ag43 (red). To document the impact of the addition of Ag43, the ratio of the reflectivity curve changes (right panel) use log(R-TAM)/log(R-TAM+Ag43) as a function of Q. Supplementary Fig. 7 documents the data acquisition and calculations. (b) Table of the fitted and calculated parameters after addition of Ag43 to the TAM. (c) MCNR curves of TamA with addition of Ag43 (left panel): responses prior to addition of Ag43 (black) and after addition of Ag43 (red). The ratio of the reflectivity curve changes (right panel) use log(R-TamA)/log(R-TamA+Ag43) as a function of Q, and Supplementary Fig. 8 details the data acquisition and calculations. Where applicable, ± denotes the standard deviation (d) Table of the fitted and calculated parameters after addition of Ag43 to TamA. Where indicated, ± denotes the standard deviation. (e) Pictorial representation summarizing movements of the TAM seen in the MCNR experimental system. (f) With the spatial constraints of the inner membrane as would occur in vivo, movements of TamB would either deform the membrane layer, or act to laterally shift TamA relative to TamB, or deform the TamB subunit.

