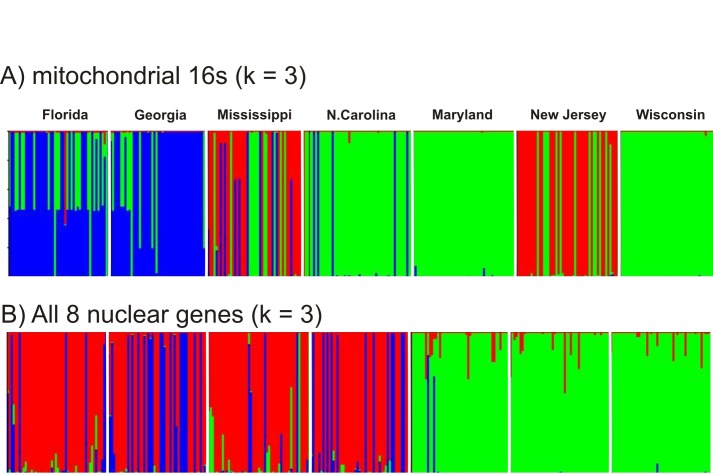
Fig 7. DISTRUCT plots created from STRUCTURE output.
Cluster membership is represented as different colors, and individual ticks were depicted as vertical bars partitioned into segments that correspond to membership coefficients in each of the seven collection sites. The numbers of genetic clusters (K) of ticks was determined on the basis of their A) 16S haplotypes or B) for all 1,155 SNPs in the 8 nuclear genes combined.

