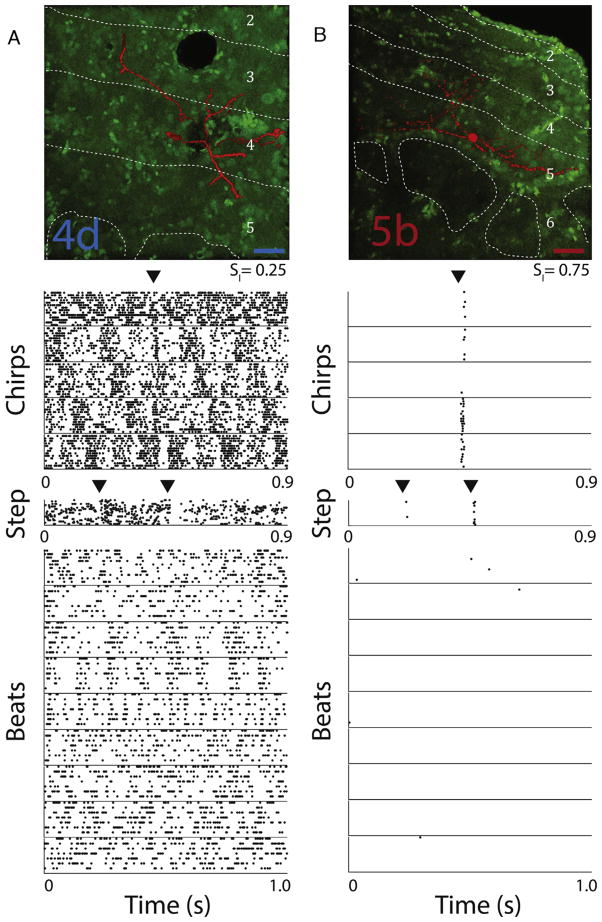
Fig. 2. Responses to electrosensory stimuli from example dense and sparse TS neurons.
(A) Top: confocal image of a dense coding TS neuron identified as a layer 4d neuron on the basis of a previous Golgi classification [5]. Dashed white lines demarcate boundaries between layers, labeled accordingly. The scale bar indicates 25 μm. Bottom: raster plots showing this neuron’s response to repeated presentations (10–20 trials) of 15 different stimuli, 5 chirps (1 courtship and 4 agonistic), 1 artificial step stimulus and 9 different beat frequencies (1, 2, 4, 8, 16, 32, 64, 128, and 256 Hz). Arrowheads indicate chirp or step onset as well as step offset. We obtained SI = 0.25 for this neuron. (B) Same as A, but for a sparse coding TS neuron identified as a layer 5b neuron. We obtained SI = 0.75 for this neuron. The scale bar indicates 25 μm. (For interpretation of the references to color in this figure legend, the reader is referred to the web version of this article.)

