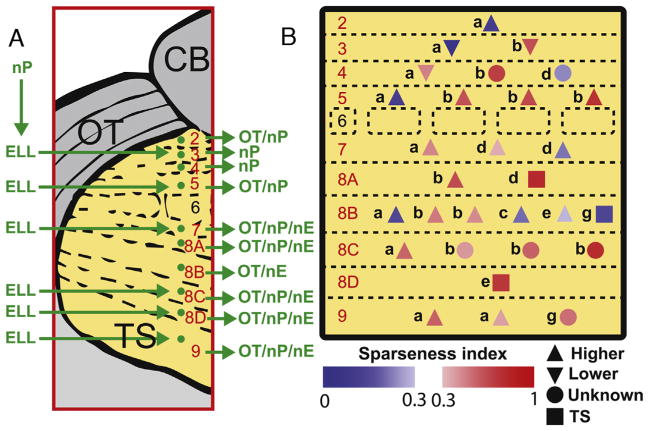
Fig. 3. Distribution and identification of sparse and dense coding TS neurons.
(A) Summary of inputs to and outputs from TS layers as per [5,6]. Note that TS layer 6 receives only input from the frequency modulation (FM) pathway that is not considered in the current study. (B) Cell type as per [5,6] and location within TS layers of sparse (red) and dense (blue) coding neurons. The colormaps indicate each neuron’s SI. Neurons marked with up triangles, squares, down triangles, or circles projected directly to higher brain areas, exclusively within TS, exclusively to lower brain areas, or to unknown brain areas, respectively. (For interpretation of the references to color in this figure legend, the reader is referred to the web version of this article.)

