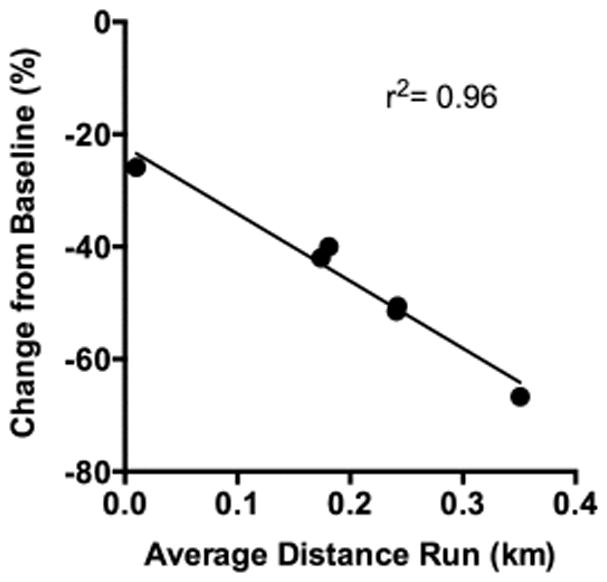
Figure 6.

Scatter plot and Pearson product moment correlation of average daily distance run in wheel and percent change from baseline PR breakpoint during exercise sessions. A strong negative correlation between these two variables was observed (p < 0.01).
