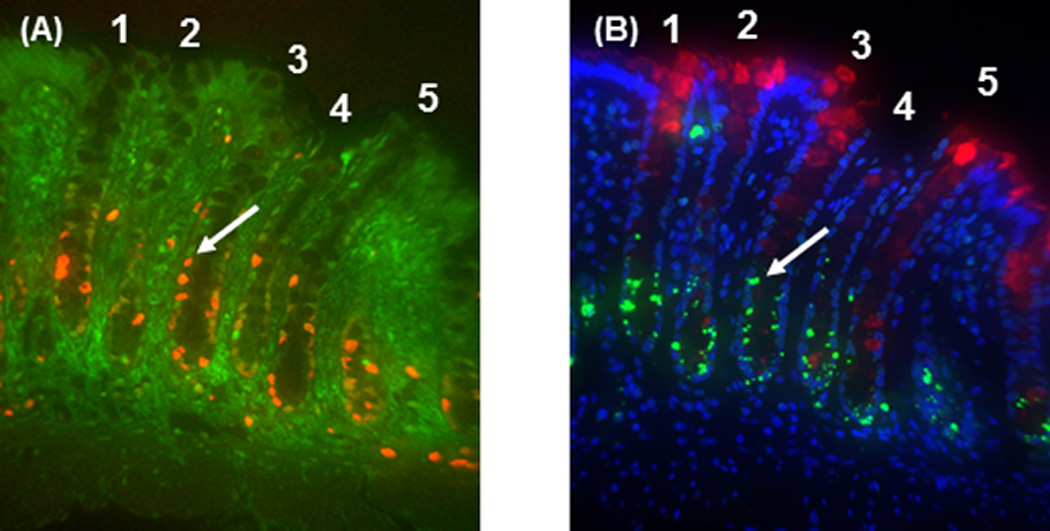
Fig. 1.

Colocalization photomicrograph (400×) of proliferation, p27Kip1, differentiation and apoptosis in serial sections. A: Proliferation (Ki-67, orange) was predominantly localized to the lower part of the crypts and p27Kip1 (green) staining was localized in the nuclei of colonic cells within crypts. B: lectin binding (red) was primarily located in the upper part of the crypt and apoptotic cells (green) were found in the lower region of the crypt 9 h after AOM injection. Blue staining represents DAPI counterstaining. Panels A and B are derived from serial sections and crypts 1–5 in panel A are the same crypts shown in panel B. Arrows show the same cell labeled for cell proliferation and p27 Kip1 in panel A, and apoptosis in panel B.
