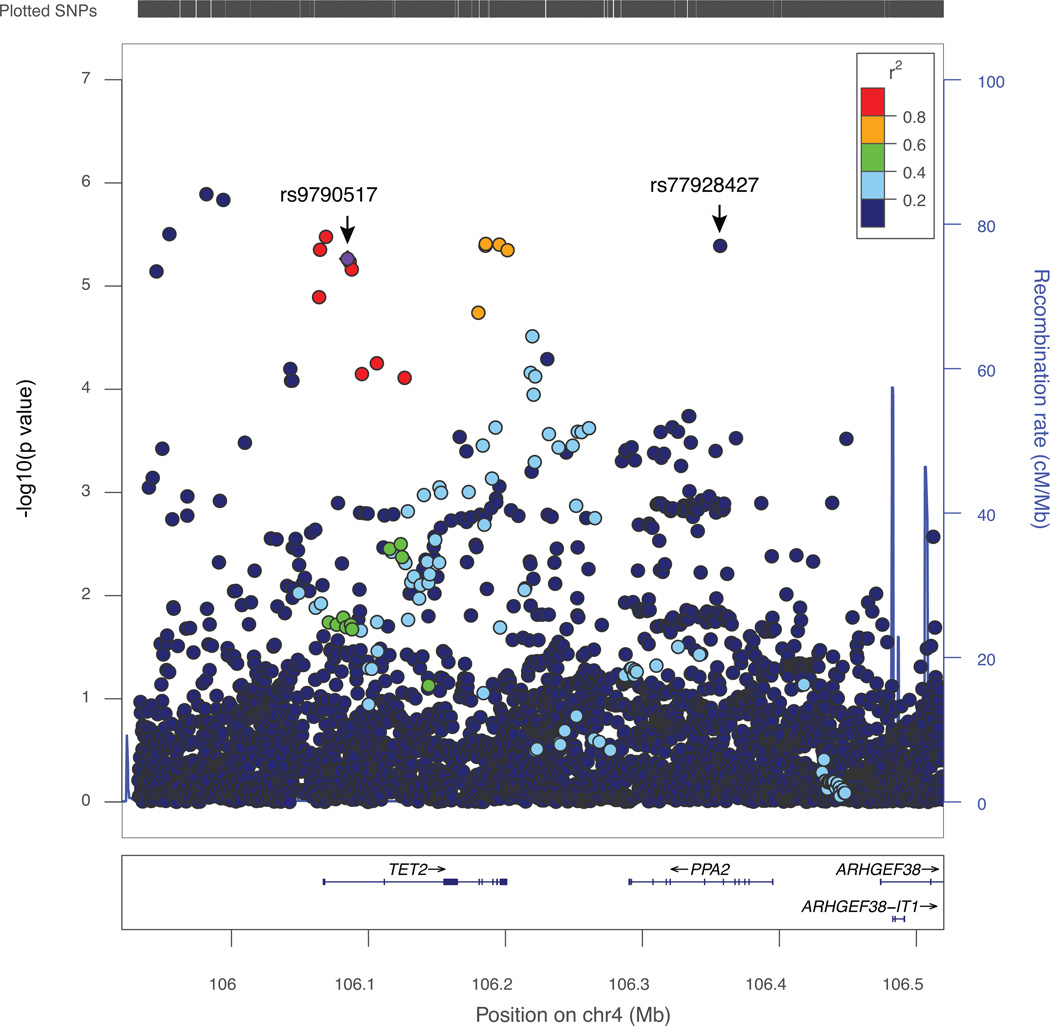
Figure 1. Regional plot of genetic variants associated with breast cancer risk at 4q24.
A) The index SNP rs9790517 is plotted in diamond purple. The LD (r2) for the index SNP with each SNP was computed based on European ancestry subjects included in the 1000 Genome Mar 2012 EUR. P values were from the single-marker analysis based on logistic regression models after adjusted for age, study sites and the first six principal components plus one additional principal component for the LMBC in analyses of data from European descendants. The plot was generated using LocusZoom (50).

