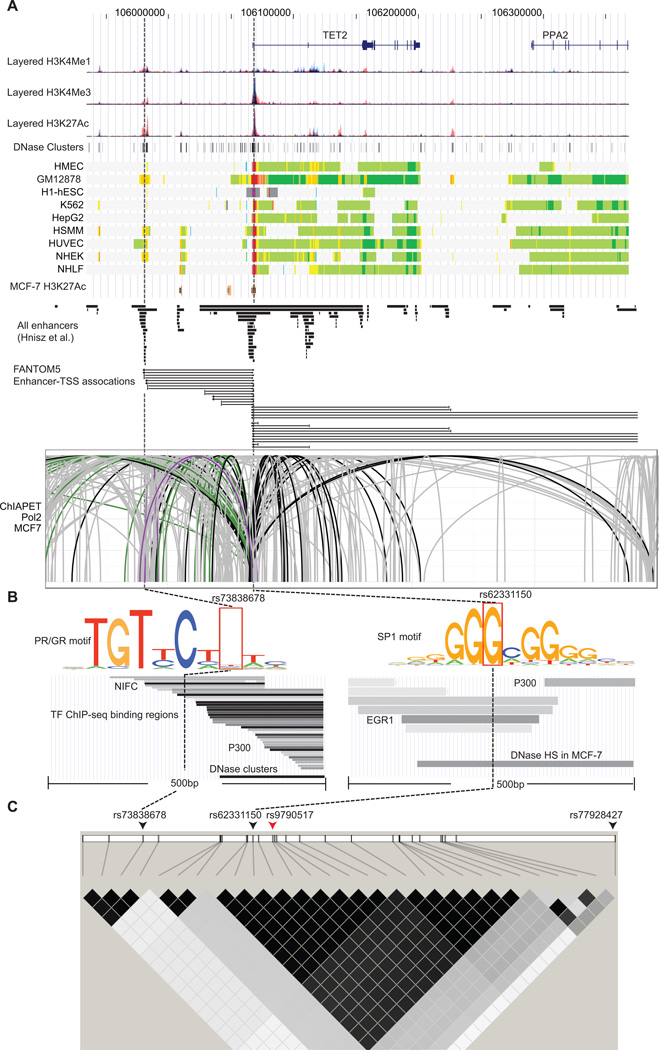
Figure 2. Functional annotation of SNPs association with breast cancer risk at 4q24.
A) Epigenetic landscape at 4q24 risk locus for breast cancer. From top to bottom, RefSeq genes (TET2 and PPA2), layered H3K4Me1, H3K4Me3 and H3K27Ac histone modifications, DNase clusters, annotation using chromatin states on the ENCODE cell lines, and H3K27Ac histone modification in MCF-7, predicted enhancers reported in the Hnisz et al. study, regulatory elements of enhancers associated with TSS and TSSs from the FANTOM5 project and ChIA-PET interactions in MCF-7 cell (mediated by RNA polymerase 2) between enhancers and TET2 promoter are shown. The signals of different layered histone modifications from the same ENCODE cell line are shown in the same color (The detailed color scheme for each ENCODE cell line described in the UCSC genome browser). The red and orange colors in chromatin states refer to active promoter and strong enhancer regions, respectively (The detailed color scheme of the chromatin states described in the previous study (27)). For ChIA-PET track, black lines represented interactions with the promoter region (−1500/+500) of TET2, and gray lines represent chromatin interactions that do not involve the TET2 promoter region. Purple and green lines represent interactions within +/− 500pb of rs73838678 and rs62331150 variants, respectively. B) Epigenetic signals of two potential functional variants rs73838678 and rs62331150. From top to bottom, lanes showing that the variant mapped to TF predicted binding motifs, TF ChIP-Seq binding peaks and DNase I hypersensitivity sites. The corresponding location of the variant is indicated by dashed line. C) LD plot for breast cancer risk associated SNPs at 4q24. In the top lane, two SNPs representing independent association signals are indicated by the black arrows. The index SNP is indicated by the red arrow. In the bottom lane, two LD SNP blocks were shown based on r2 values, which were computed based on the genotype data from the BCAC.

