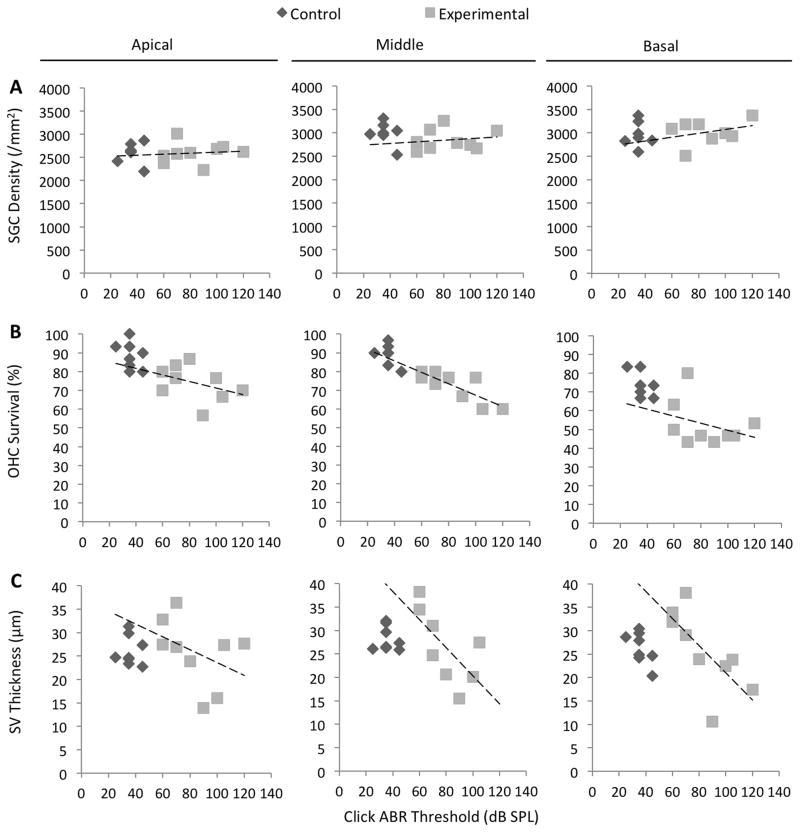
Figure 5.
Correlations of ABR thresholds with cochlear duct histomorphology. n = 8 ears for control mice, and n = 9 ears for experimental mice. Dashed lines represent Pearson correlations for experimental ears. (A) Click ABR thresholds were not correlated with spiral ganglion cell (SGC) density in the apical, middle, or basal turns of experimental cochleae (R = 0.10, p = 0.80; R = 0.16, p = 0.67; and R = 0.32, p = 0.43, respectively). (B) Click ABR thresholds were correlated with outer hair cell (OHC) survival in the middle turn (R = −0.81, p = 0.008) but not in the apical or basal turns of experimental ears (R = −0.40, p = 0.29; and R = −0.33, p = 0.38, respectively). (C) Click ABR thresholds were correlated with stria vascularis (SV) thickness in the basal turn (R = −0.72, p = 0.03) but the correlation was not significant in the apical or middle turn (R = −0.41, p = 0.28; or R = −0.67, p = 0.07, respectively).

