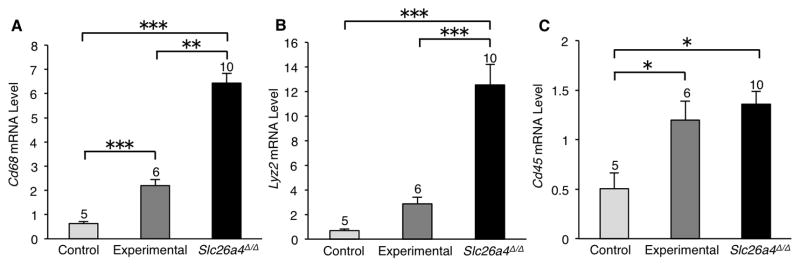
Figure 7.
Expression of macrophage marker genes in stria vascularis. Quantitative RT-PCR analysis was used to measure mRNA levels in stria vascularis from mice at 12 months of age. Data are presented as mean values (± S.E.) of 3 technical replicates for groups of cochleae of each genotype. The number of cochleae used for each genotype group is indicated at the top of each bar. One-way ANOVA was used to identify differences among genotype groups. The mean mRNA levels of Cd68 (A) and Cd45 (C) were elevated in experimental striae in comparison to control striae. A similar trend was seen in Lyz2 mRNA levels (B). Asterisks indicate significant differences: *p < 0.05, **p < 0.01, and ***p < 0.005.

