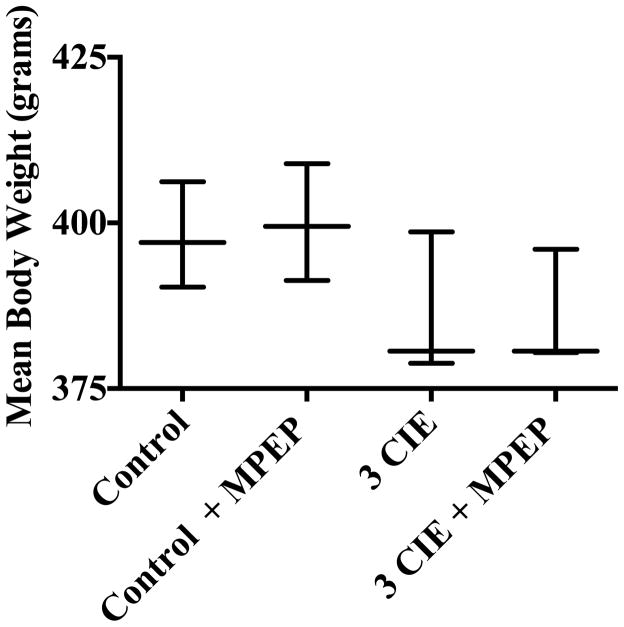
Figure 3.
Body weight data were obtained daily on Week 1, 2, and 3. Data points show the range and means for subjects exposed to experimental groups. ** = statistical significance (p <0.05) compared to subjects administered an isocaloric control diet. N=7 for control subjects; N=8 for control with MPEP; N=6 for ethanol subjects; N=8 for subjects administered ethanol and MPEP

