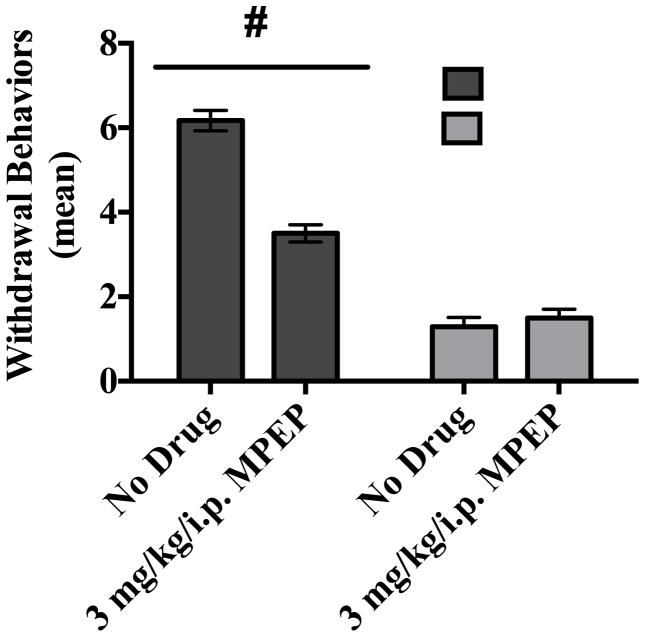
Figure 4.
Withdrawal behavior was assessed during withdrawal on Day 6 of Week 3. Data points show mean scores in withdrawal behavior observed during the third consecutive withdrawal from CIE. # = statistical drug by diet interaction (p <0.001). N=7 for control subjects; N=8 for control with MPEP; N=6 for ethanol subjects; N=8 for subjects administered ethanol and MPEP.

