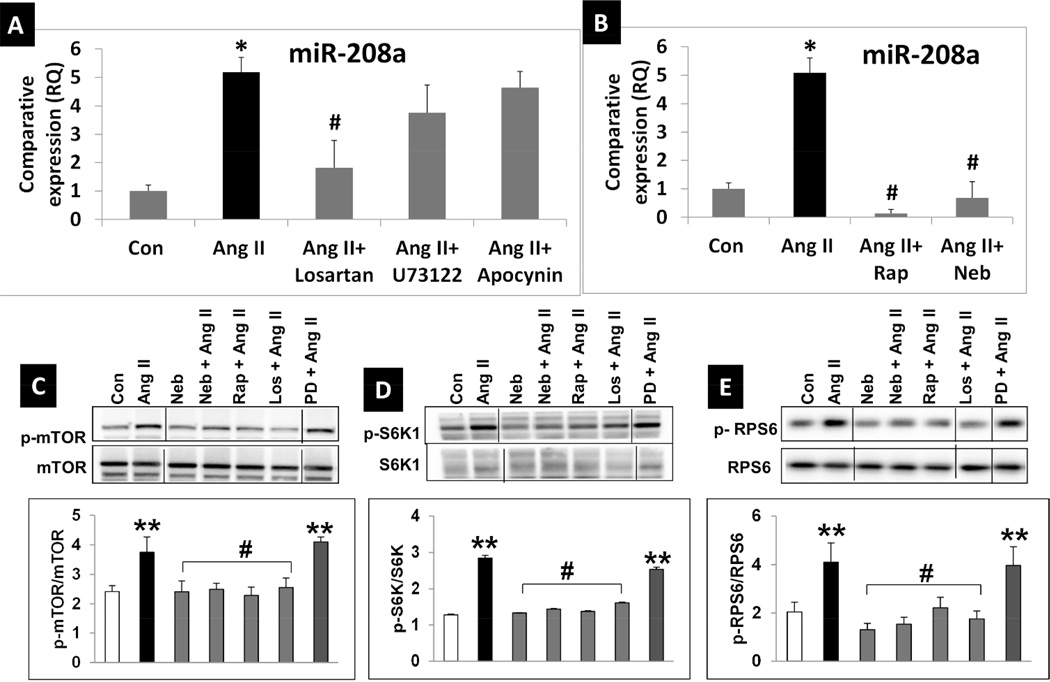
Fig. 1. Ang II activates, while Rap and Neb suppress Ang II activated mTORC1 signaling and miR-208a expression in mouse cardiomyocyte HL-1 cells.
A: qRT-PCR data expressed as RQ values shows that Ang II (100nM: 12hrs) increases miR-208a while the AT1R blocker losartan suppressed Ang II-induced increases in miR-208a expression. Neither the Phospholipase C inhibitor U73122 (10µM) nor the NADPH oxidase inhibitor apocynin (0.5mM) could effectively suppress Ang II-induced miR-208a expression. B: qRT-PCR data expressed as RQ values show that addition of Neb (1µM) or Rap (10nM) to the incubation medium during the overnight treatment suppresses the Ang II-induced increase in miR-208a expression. n ≥3 treatments for each treatment group except for Ang II. Since Ang II treatment was repeated with each data set shown in Fig.1 A and B and in Fig. 3, biological replicates for Ang II was ≥10. qRT-PCR was performed in triplicate for RNA isolated from each biological sample. Values are means ± SEM. *p < 0.05 for Ang II treated vs. untreated (Con) cells. #p < 0.05 for Ang II treated vs. Neb, Rap, or losartan treated cells. C-E: Representative images of autoradiograms showing elevated levels of pSer2448 mTOR (C), pThr389 S6K1 (D), and pSer235/236RPS6 (E) in HL-1 cells incubated with Ang II (100nM: 12hrs) and suppression of this effect by co-treatment with Neb (10nM) Rap (1µM) or the AT1R blocker losartan (1µM), but not by AT2R blocker PD123319 (5µM). Images are from same gel with intervening lanes excluded for clarity. Graphs show results of densitometric analysis of the intensity of the phosphorylated protein bands after adjusting for the intensity of total protein bands (tmTOR, tS6K1, tRPS6). Values are means ± SEM. N ≥3 for each treatment group. **p < 0.05 for untreated (Con) vs. Ang II treated or PD+AngII treated. #p < 0.05 for Ang II treated vs. Neb, Rap, or losartan treated cells.

