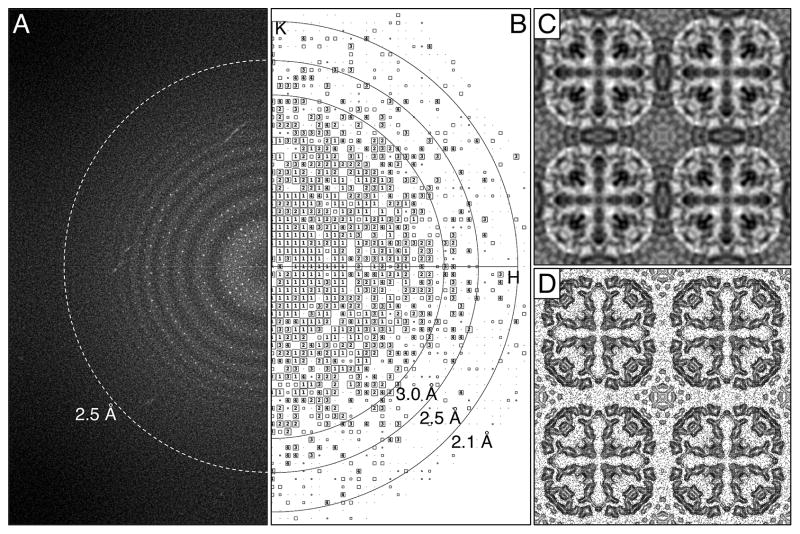
Fig. 2.
Imaging of AQP0 2D crystals with a K2 Summit camera mounted on an FEI Polara electron microscope operated at 300 kV. (A) The power spectrum of a typical drift-corrected image recorded at a calibrated magnification of 50,926x after binning over 2 x 2 pixels shows Thon rings to a resolution of about 2.5 Å (indicated by dashed ring). (B) The IQ plot of a typical AQP0 2D crystal after lattice unbending shows IQ = 3 spots to a resolution of about 2.3 Å. (C) Projection map of AQP0 at 2.6 Å resolution obtained by merging the best seven images. (D) Projection map shown as contour plot. Panels C and D show four AQP0 unit cells, each with a side length of a = b = 65.5 Å.

