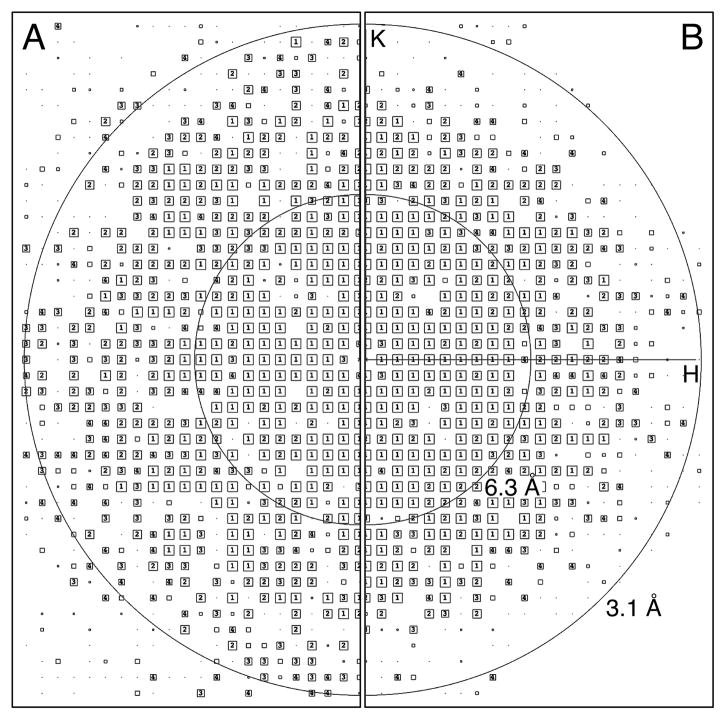
Fig. 4.
Information beyond the physical Nyquist frequency. (A) AQP0 2D crystals were imaged with a K2 Summit camera mounted on an FEI Tecnai F20 electron microscope in super-resolution mode at a calibrated magnification of 40,410x, and the drift-corrected images were binned over 2 x 2 pixels. As the physical Nyquist frequency is 1/(2.48 Å), all reflections seen in the IQ plot are below the physical Nyquist frequency and within the normal resolution range. (B) AQP0 2D crystals were also imaged at a magnification of 15,858x, and the drift-corrected images were not binned. As the physical Nyquist frequency is 1/(6.3 Å), all reflections seen in the IQ plot beyond this resolution are above the physical Nyquist frequency and in the super-resolution range.

