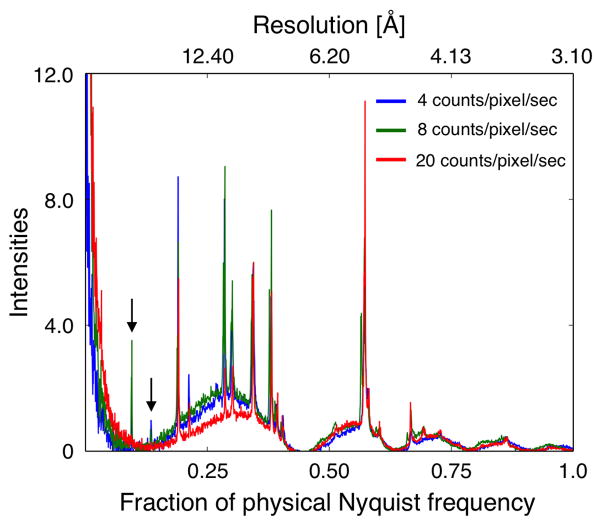
Fig. 5.
Radial averages of power spectra calculated from representative images recorded with different dose rates. Diffraction spots in the low-resolution range are clearly seen in the images recorded with dose rates of 4 and 8 counts/pixel/sec (arrows). By contrast, due the greater coincidence loss, these diffraction spots are no longer detectable in the image recorded with a dose rate of 20 counts/pixel/sec.

