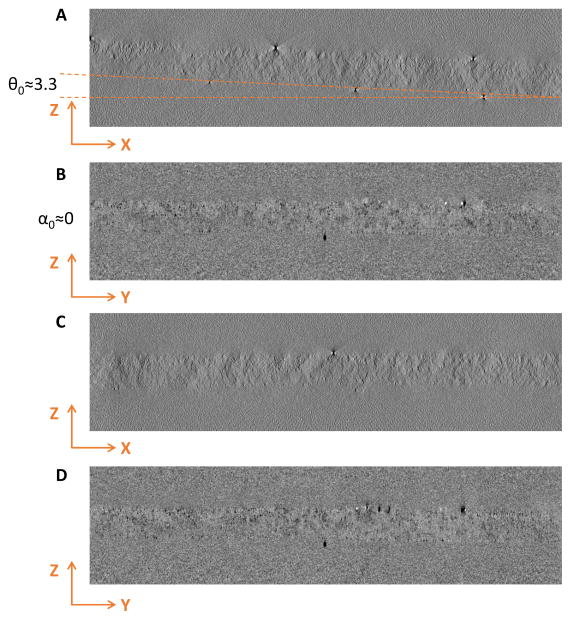
Fig. 4. Comparison of reconstruction of the stained tilt series shown in Fig. 1A before and after correction of residual tilt.
Sections (A) and (B) are XZ and YZ planes before tilt correction. Sections (C) and (D) are XZ and YZ planes after tilt correction. Note that the sample plane is horizontal after tilt correction (C, D) and the measured thickness is close to fitted value, indicating that the fitted parameters are reliable for stained datasets.

