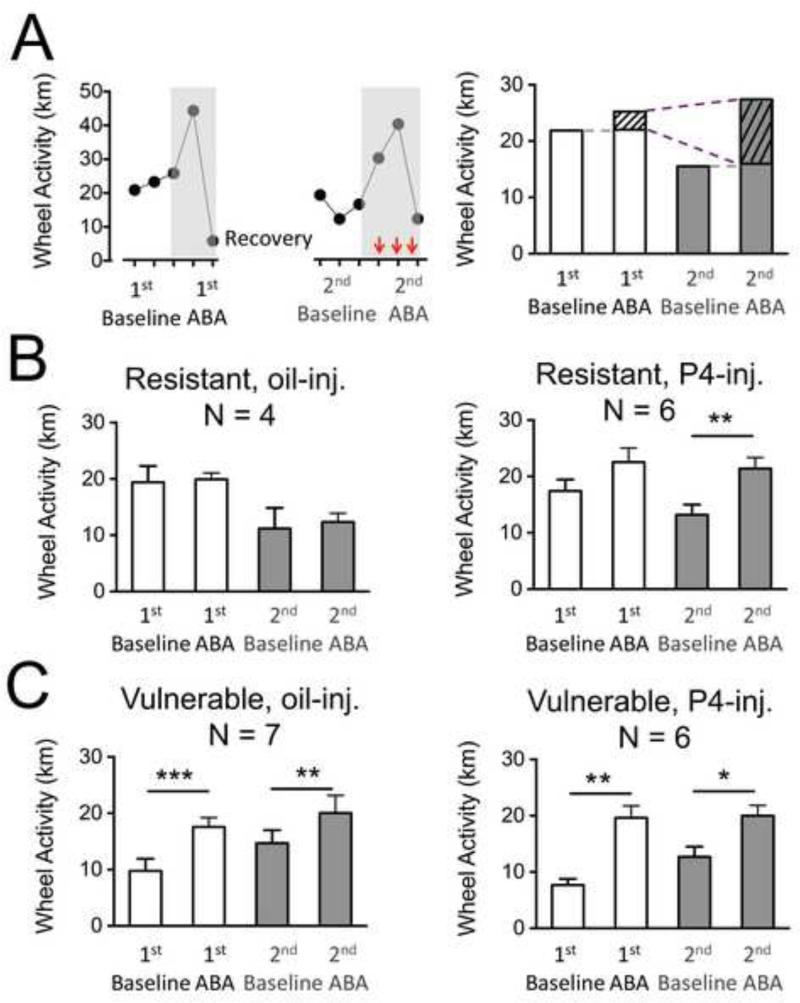
Figure 3. Averaged wheel activity per 24 hours during the four periods of a repeated ABA paradigm.
Panel A, left: Daily wheel running activity (WRA) of one animal in the relapse paradigm of ABA. The grey shaded boxes highlight the food restriction periods in the 1st and 2nd ABA. Red (dark gray) arrows indicate the last three days of the 2nd ABA when injections of P4 or oil were given.
Panel A, right: The 1st baseline and 2nd baseline WRA are averaged distances run on the wheel on the two days preceding food restriction in the 1st ABA and 2nd ABA respectively. In this example, the 2nd baseline is less than the 1st baseline, reflecting resistance that is acquired during recovery. Average distance run on the wheel during the three days of the 1st ABA and the last three days of the 2nd ABA (shown using the vertical red arrows in the left panel) are used as measure of response to ABA. The first day of food restriction (FR1) of the 2nd ABA was not used in the average because the mice did not receive an injection on that day. The dashed gray lines mark the level of baseline activity relative to the ABA activity. The portions of the average activity in the 1st and 2nd ABA marked with slanted lines refer to the measure called severity of ABA (SOA), reflecting the food restriction-evoked component of WRA. The dashed purple lines indicate the comparison of the SOAs of the 1st and 2nd ABAs, used to compute the change in SOA. In this example, the change in SOA is a positive value, indicating sensitization. This is a pattern observed for the P4-injected resistant animals (Fig. 3B-right).
Panels B and C: The wheel activities of all animals in a sub-group are averaged for each period of the experiment. For each animal, the values that are used for the group average are computed as shown in Panel A, right.
Panel B, left: Resistant animals (RWA 2nd baseline < 1st baseline) injected with oil show a non-significant increase in WRA in the ABA period compared to baseline in both episodes of ABA.
Panel B, right: Resistant animals (WRA 2nd baseline < 1st baseline) injected with P4 show a significant increase in WRA in the 2nd ABA period compared to baseline immediately prior to the 2nd ABA.
Panel C, left: Vulnerable animals (WRA 2nd baseline > 1st baseline) injected with oil show a significant increase in WRA in the ABA period compared to baseline in both episodes of ABA.
Panel C, right: Vulnerable animals (WRA 2nd baseline > 1st baseline) injected with P4 show a significant increase in WRA in the ABA period compared to baseline in both episodes of ABA.
* indicates p < 0.05 ; ** indicates p < 0.01 ; *** indicates p < 0.001.

