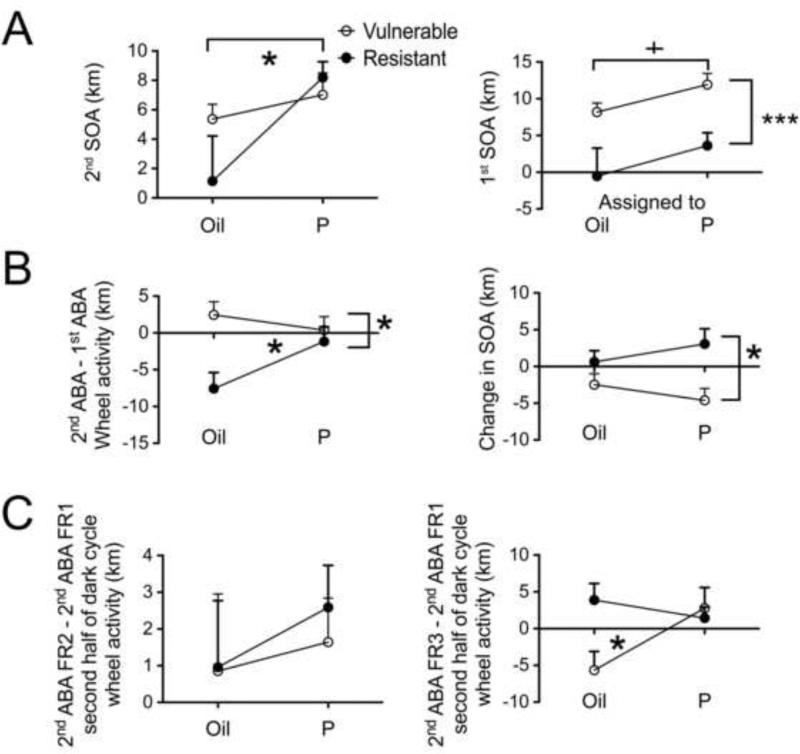
Figure 5. P4 exacerbates the response to the 2nd ABA.
Panel A, left graph shows that P4-injected mice responded with higher SOA to the 2nd ABA than did the oil-injected mice (* indicates p = 0.012 by two-way ANOVA using drug and change in vulnerability as fixed factors). The y-axis shows the averaged WRA during the 2nd ABA adjusted for the 2nd baseline WRA, a measure that reflects food- restriction induced increase in activity (SOA).
Panel A, right graph shows that animals categorized as vulnerable (P- or oil-injected) based on a positive value for 2nd baseline minus 1st baseline WRA showed a higher SOA to the 1st ABA than the animals categorized as resistant (P-or oil-injected) (*** indicates p = 0.0003 by two-way ANOVA using drug and change in vulnerability as fixed factors).
Despite a trend to a difference between the P4-injected (vulnerable plus resistant) and oil-injected (vulnerable plus resistant) mice in their SOA in the 1st ABA (+ indicates p = 0.058), post hoc tests showed no difference between the animals that would later receive P4 within the resistant or vulnerable groups or oil injections within the resistant or vulnerable groups. This indicates that there was no pre-existing difference between the animals assigned to the two drug groups within each category of resistant and vulnerable animals.
Panel B, left graph shows response severity in 2nd ABA compared to the 1st ABA. A two-way ANOVA using drug and change in vulnerability as fixed factors shows a main effect of vulnerability and a significant interaction between the factors of vulnerability and drug injection (* indicates p < 0.05). P4 injection removes the resistance of mice exhibited in the 2nd baseline period.
Panel B, right graph shows change in SOA. A two-way ANOVA using drug and change in vulnerability as fixed factors shows a main effect of vulnerability, no effect of P4 and no interaction between the factors of vulnerability and drug (* indicates p < 0.05). Post hoc tests reveal that the P4-injected resistant animals show a sensitization reflected in the change in SOA as compared to the P4-injected vulnerable animals.
Panel C, left graph shows the change in WRA during the second half of dark cycle (between 7 and 13 hours after P4 injection) from the first day of food restriction (FR1) to the second day of food restriction (FR2) in the 2nd ABA. There are no differences between either the vulnerable and resistant groups or the P4-injected and oil-injected groups.
Panel C, right graph shows the change in WRA during the second half of dark cycle (between 7 and 13 hours after P4 injection) from the first day of food restriction (FR1) to the third day of food restriction (FR3) in the 2nd ABA. There is a significant interaction between the vulnerability and drug groups indicated by * (p < 0.05), suggesting that P4 removes the resistance of animals causing them to responding severely, with a delay of 7 hours, specifically after the second injection.

