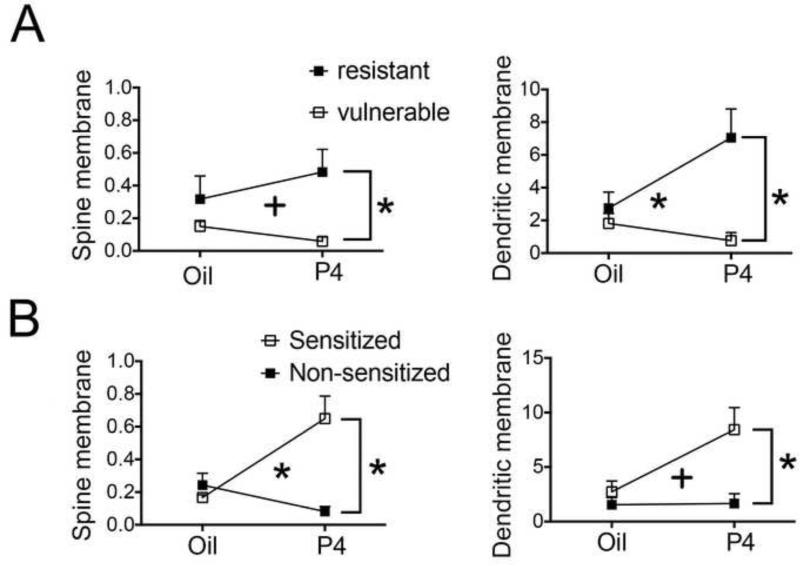
Figure 7. Effect of change in vulnerability and P4 on α4-immunoreactivity.
Panels A - left and A-right show mean values and standard errors of mean of α4-immunoreactivity along the plasma membrane in spines (left graphs) and dendritic shafts (right graphs) of vulnerable and resistant groups as well as P4- and oil-injected groups. Two-way ANOVAs using vulnerability and drug as fixed factors show a significant effect of vulnerability and interaction between the fixed factors for all measures.
Panels B left and right show mean values and standard errors of the mean of α4-immunoreactivity along the plasma membrane in spines (left graph) and dendritic shafts (right graph) of sensitized and non-sensitized groups as well as progesterone-injected and oil-injected groups. Two-way ANOVAs using change in SOA and drug as fixed factors show a significant effect of change in SOA and interaction between the fixed factors for all measures. ‘Spine membrane’ refers to immunoreactivity at the plasma membrane of spines.
* indicates p < 0.5 and + indicates p < 0.1.

